
The Traffic Light System for Regulating Salmon Farming in Norway
– A reassessment.
Summary
This analysis of the Traffic Light System has found that this form of regulation of the salmon farming industry has no redeeming features. There is no evidence that its application has safeguarded the future of wild salmon in Norway.
The major flaw in its approach is the scientific communities’ lack of basic knowledge of parasite ecology which would recognise that sea lice are scattered through the fish population as an aggregated distribution. The main feature of this form of distribution is that the majority of host sea trout and salmon carry no or few sea lice. If the majority of these fish are lice free, they cannot be at risk of mortality.
The lack of this knowledge is compounded by poor sampling that targets the few fish that do carry high lice loads and can do so naturally, irrespective of the presence or absence of salmon farming.
The Traffic Light regulation is further compounded by a reliance on models that do not reflect the occurrence of sea lice in the real world. A model is only as effective of the perceptions of those involved in its construction. The lack of validation has also undermined the authenticity of the models. The models include particle distribution, but sea lice are not particles, they are a naturally occurring living organism.
There is an urgent need to reassess the existing narrative about sea lice. However, the existing scientific community appears extremely reluctant to participate in any discussion. This highlights the need to involve the industry and business in any future conversation.
Key Points
Distribution.
Parasites including sea lice are spread throughout the host population as an aggregated distribution, which means that the majority of host fish carry no or very few sea lice and thus are at very low risk of mortality. The Expert Group and supporting scientists fail to consider this important aspect of parasite ecology in their assessment of the impacts of sea lice on wild fish.
Sampling.
The assessment of the impact of sea lice is undermined by poor sampling of wild fish. There is a great deal of variability in the sampling between the thirteen production areas with respect to the number of samplings undertaken (3-50) and the number of fish caught (54-1097). In addition, there was variability of the number of fish caught per sampling ranging (1-131). The majority of sampling caught less than 10 fish. The largest number of samplings (18) caught just one fish. Low sample numbers cannot be judged to be representative of the wild fish population.
Traps and Nets
Sampling has been undertaken by nets and traps with no clear rationale for the use of these methods of sampling. Analysis of the catch data shows that nets are more likely to provide a better approximation of the wild fish population than traps.
Taranger index of mortality
Whilst Taranger’s index is flawed as most samples collected for the NALO data, fall short of the minimum number of fish required, the mortality index would suggest that at least six production areas should be classified as red in 2024. This is simply an artefact of the poor sampling.
Measures of parasite infestation
Infestation of host fish has been measured by intensity in the IMR assessment. When intensity of applied to each production area at least four production areas should be classified as red, however, this assessment is an artefact of poor sampling.
Salmon Trawls
As with nets and traps employed to catch sea rout, trawling for salmon smolts is plagued by poor sampling. In PO 3 which is classified as red in 2024, the number of fish caught ranges from 1 to 27 fish. The largest number of fish caught in one trawl was 202 however 25% of all trawls caught just one fish.
Sentinel cages
Whist the Expert Group no longer use sentinel cages for the assessment of lice infestation, consideration has not been given to the possibility that lice can be spread by wild fish and not by dispersed larval lice. There is evidence that larval lice dispersed from farms are so dilute in number in the sea within a short distance from a farm that they will be absolute minimal risk of infestation.
Use of models
Sea lice risk assessment has increasing become deponent on the use of modelling especially particle dispersal models. However, sea lice are living organisms not particles. Models do not take into account the natural sea lice host location process.
Introductory Parasite Science
An Introduction to Animal Parasitology (third edition) is a textbook by J.D. Smyth, Emeritus Professor of Parasitology at the University of London published by the Cambridge University Press in (1994) (Previous editions in 1962 and 1979). This textbook is said to appeal to all students with an interest in parasitology as well as being of interest to research workers in the field. In one page, this textbook provides an excellent overview of parasite ecology that seemingly is not understood by many working in sea lice research. The text of this page is reproduced below, without the many references, for ease of reading.
The first page (of 548 pages) of this textbook is headed Chapter 1 – Parasitism, what is a parasite? It begins with the sub-section 1.1 Animal associations.
“The majority of animals live independently in their natural habitats, seeking their own food materials and utilising free water and oxygen for their metabolic processes. Between some animals, however a variety of patterns of association have developed and these may be broadly divided into two groups: homogenetic associations – those between individuals of the same genotype; and heterogenetic associations – those between individuals of different genotype.
Individuals of the same species may form loosely united communities such as herds of cattle or flocks of sheep whilst others such as some species of ants or bees may form elaborately organised communities in which individual members exhibit considerable division of labour or specialisation.
Heterogenetic associations are in general much more complex, and a number of terms have been developed to describe them. Like many terms used in biology, these are essentially operational words which are definable only within broad limits and not in absolute terms.
They do, nevertheless, serve a useful role in enabling us to file data into convenient though not watertight compartments. Terms such as commensalism, phoresis, symbiosis, mutualism, and parasitism have been widely used for various types of heterogenetic association and their definition – which has always been controversial has been much discussed by early workers in the field. These terms were developed in a period when little data on the possible physiological and/or mathematical basis of such an association were available.
Within recent years, the situation has changed somewhat, and although information is still meagre, the general increase in knowledge of animal physiology, biochemistry, and population dynamics enables these associations to be considered on a broader basis. In particular it is increasingly recognised that Parasitology is essentially a branch of Ecology, and the phenomenon of parasitism can be considered as an ecological relationship between two populations of different species and much attention has been paid to the quantitative aspects of this relationship.
An important conclusion that has emerged from such studies is instead of parasites being randomly distributed within the host population (as might be expected) they tend to be over-dispersed i.e. a few hosts harbour large numbers of parasites and many hosts harbour only a few. That this type of frequency distribution is a major characteristic of parasitism was first postulated by Crofton (1971) and has since been confirmed by numerous studies on many host-parasite systems.
A negative binomial has proved to be a good empirical description of this pattern of infection and an example is shown.
This shows the distribution of the metacercaria of the trematode Displostomum spathaceum which commonly occurs in the eyes of fish throughout the world. The lens of a few fish are found to be infected with enormous numbers of larvae (over 400 in one fish) but most only contain relatively few and its distribution closely follows a negative binomial pattern.”

It should be stressed that the above text comes from the very first page of a parasitology textbook and it is very clear in its message. Parasites are distributed differently to other animals and high level of infestations are a natural occurrence in parasite populations. In the case of sea lice, such high numbers of parasites occur regardless of the presence or absence of a salmon farm. It should also be noted that the negative binomial graph from the textbook shows an increasing number of parasites simply because the scale which begins as individual digits is grouped as 11-20 and thereafter all infestations above 20. If the scale is kept constant, the tail end will diminish in size with increasing infestation.
Introduction
According to the Expert Group report [1], the categories for sea lice-induced mortality for wild salmon post smolt in the thirteen production areas for 2023 are as follows:
(1) High in PO3 (Red)
(2) Moderate in PO2, PO4, PO5, PO6 and PO7 (Yellow)
(3) Low in PO1, PO8, PO9, PO10, PO11, PO12 and PO13 (Green)
Pages 12 and 13 of the Expert Group report includes an explanation of how the limit values for the infestation levels of sea lice on wild salmon fish are derived. This section states:
The number of lice per gram of fish weight is used to estimate the probability that an migrating salmon post smolt will die due to sea lice. To calculate mortality, a function must be used that relates lice per gram of fish weight to mortality, or threshold values. Based on the best available knowledge, Taranger et al. (2012) proposed the following limit values for post smolt of salmon smolt and first-time migrating sea trout of less than 150g in weight.
100% of individuals with more than 0.3 lice per gram of fish weight will die;
50% of individuals with 0.2-0.3 lice per gram of fish weight will die;
20% of individuals with 0.1-0.2 lice per gram of fish weight will die;
0% of individuals with less than 0.1 lice per gram of fish weight will die.
The threshold levels referred to above (Taranger et al. 2012) are based on relatively few laboratory tests and assessments of data from the field, and the values must be regarded as indicative and as first-generation indicator values. As pointed out by Taranger et al. (2012), more are needed attempts for further verification and validation, given the importance of these limits.
The credibility of the Traffic Light assessment is brought into question initially with two key points:
- The function used to calculate mortality was first proposed in the report by Taranger et al. (2012)[2] which is now over twelve years ago. The Expert Group highlight that this function has yet to be verified or validated. Certainly, the Evaluation Committee that reported in December 2021[3] recommended that the threshold levels should be regularly assessed but those used in the 2023 assessment remain the same as proposed by Taranger et al. in 2012.
- On page 25 of Taranger et al. (2012) the report states:
“It is assumed that the sample size is sufficiently large (preferably at least 100 fish), that the fish are collected during the main part of the emigration period, and that the collections are concentrated in outer parts of the emigration route so that the actual infection pressure experienced by the fish is best represented.”
Sample Size
Whilst Taranger et al. (2012) recommends a sample size of at least 100 fish, the implication is that the 100 fish should be caught at the same time. This does not equate to a sample of 100 fish made up of small numbers of fish caught in multiple samplings. The outcome from such sampling can be very different.
A Government of Canada (Department of Fisheries and Oceans) report from 2014[4] considered the size of samples used to monitored sea lice on wild salmon in Canada. The report states on page 10:
“SAMPLE SIZE The main purpose of calculating sample sizes during the planning stages of a study is to ensure that the study will be that of an appropriate size to ensure that statistically significant differences, if they exist, can be recognized. However, this activity can also be beneficial to understand the number of resources needed to complete the study and to provide an indication if the study can be conducted given available resources. The selection of sample size should, were possible, match the types of statistical analysis which are appropriate for the study. Sample size calculations require a variety of inputs including host population size, expected prevalence of sea lice and the confidence limits that are acceptable to the researcher. As described above there are numerous on-line programs that enable researchers to calculate sample size. The number of fish retained during sea lice surveys and the number of fish eventually analysed (sample size) is an important decision for researchers. Budgets, resources, and logistics need to factor into this decision, as well as the level of accuracy and precision that is required to address the question at hand. Unfortunately, sea lice like many other parasites are unequally distributed in host populations with some hosts harbouring many and most harbouring few or none. Furthermore, the goal of many studies is to identify small changes in sea lice numbers within a host population due to factors such as salmon farming. Taken together this requires accuracy and precision of estimates of prevalence (proportion infected), mean intensity (parasites per infected individual) and mean abundance (parasites per individuals examined) measurements that are strongly influenced by sample size. It is important, wherever possible, that approximately equal numbers of hosts are sampled from each host species, host demographic group (e.g., age), and sampling unit (e.g., location, date, etc.). This strategy overcomes some problems that can be associated with highly aggregated sea lice distributions within host populations. For example, the highly aggregated nature of sea lice (abundance curve skewed strongly to the left) means that as sample size decreases there is a greater probability that prevalence, abundance, and intensity will be underestimated. This issue makes the comparison of sea lice abundance between sites that have large differences in sample size problematic at best. In situations where this cannot be avoided researchers need to consider this issue carefully when interpreting their data.”
However, the authors of this report, Johnson and Jones, do not make any specific recommendations as to what constitutes an acceptable size of any sample.
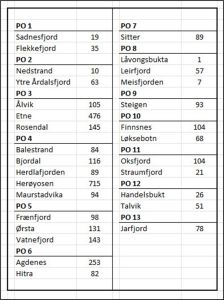
The NALO sea lice data[5] lists the complete record of sampling for all 13 production areas for 2023 (also for 2018 to 2022 as referenced throughout this document). For 2023, Table 1 lists the number of samplings for each production area.
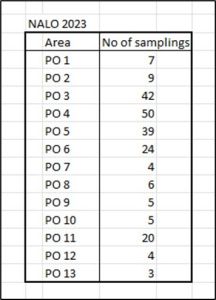
Table 1: Number of samplings for fish undertaken to measure sea lice infestation within each production area.
There is a huge range of samplings ranging from just 3 in number in PO 13 to 50 in PO 4. There is no clear explanation in any report as to how the number of samplings undertaken in each production area was decided.
The Canadian DFO report does state that:
It is important, wherever possible, that approximately equal numbers of hosts are sampled from each sampling unit (e.g., location, date, etc.).
The NALO sea lice data also shows that each production area was sampled differently in terms of location (Table 2).
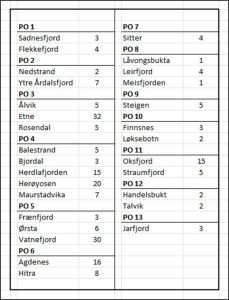
Table 2. Number of samplings at each location within each production area.
Table 2 shows that the wide range of samplings that is found between production areas is repeated within each production area. The number of samplings ranged from just one to a maximum of thirty-two. There was also variation in the number of locations sampled within production areas ranging from one to five.
The Canadian DFO report also refers to the need to sample equal numbers of host fish. The NALO sea lice data for number of host fish sampled for each production area during 2023 appears in Table 3.
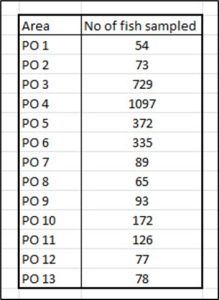
Table 3: Number of fish sampled in each production area.
Table 4: Number of fish sampled at each site within the 13 production areas.
The question is whether these variations in sampling make any difference to the outcome of the Traffic Light assessment.
The largest number of samples were collected in production area 4. In total 1,097 fish were collected during 50 separate samplings from 5 different locations. If the lice count per fish is plotted as a percentage of the total fish caught, then the resulting graph is shown in Figure 1.
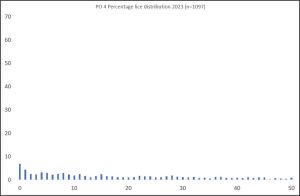
Figure 1. Number of lice per fish on sea trout sampled in PO 4 during 2023.
77.8% of the fish sampled in PO 4 were carrying more than 5 lice with one fish carrying a maximum of 237 lice of varying life stages. There is a slight weighting towards host fish with the lowest number of lice. The largest percentage of fish sampled were carrying no lice at all. This equates to 6.8% of the total.
The implication of this distribution will be discussed at the end of this section.
Graphical representations have been made of the numbers of lice infesting the host fish caught in all of the 13 production areas and given the variation in the number of fish caught and the number of samples taken, a wide range of lice distributions can be observed. These will appear at the end of this report.
When all the host fish caught during 2023 are amalgamated into one graph (Figure 2), it can be clearly seen that more fish have fewer or no lice. The percentage of host fish with more than 5 lice has dropped to 57.3%. The number of fish carrying no lice has increased to 18%.
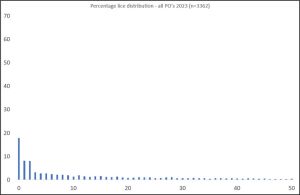
Figure 2. Number of lice per fish on sea trout sampled across all the production areas during 2023.
This shape of distribution has been recorded in relation to sea lice by Helland et al. (2015)[6]. Their graph is shown in Fig 3. It is in two parts; the upper graph showing the whole series up to a lice count of 586 whilst the lower graph shows the infestation levels up to 50 lice.
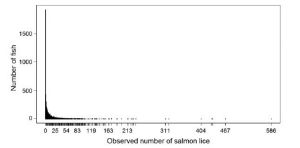
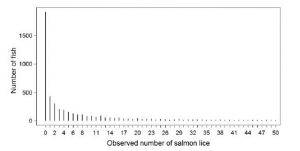
Figure 3: Sea lice distribution from Helland et.at (2015).
The graph is for lice infestation of sea trout (4,610) and Arctic char (280) previously caught by gill net from 2004 to 2010 at 41 sampling sites in 15 Norwegian fjords on 244 sampling occasions. Of the sampled fish, 1,916 carried no lice (39%). As the raw data is not available, an estimation of the number of fish with 2 to 13 lice is 1,760 which means that about 16% exceeded the 0.1 lice g level established by Taranger at al. (2012) and were at risk of mortality and therefore 84% were not at risk.
The paper by Helland et al. (2015) investigated various statistical methods as a way of expressing sea lice infestation. They did not consider the implications of the infestation levels identified.
This form of graph in statistical terms is a negative binomial distribution but it is also know as an aggregated distribution. Poulin (1998[7]) describes an aggregated distribution as that most host individuals harbour no of few parasites and few hosts harbour many parasites.
The description of an aggregated distribution is graphically represented in generalised form on Wikipedia[8]
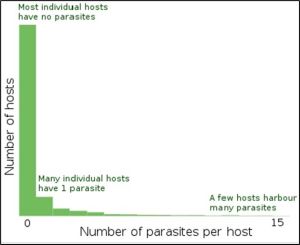
Figure 4: Description of distribution of parasite infestation of hosts.
All parasites, not just sea lice, are aggregated to some degree amongst their hosts to the point that Crofton (1971) [9] proposed that this typical population distribution should become part of the definition of what is a parasite.
Clearly, if most hosts (salmon/sea trout) carry no or few parasites (sea lice), they cannot be at risk of mortality.
If the graphical representation of the infestation of hosts does not take the form of an aggregated distribution as in Figure 1 then either:
- The infesting organism Is not a parasite .
- The sampling is inadequate.
The aggregated distribution of parasites is not mentioned or discussed in the Expert Group report yet is crucial to the understanding of sea lice infestation. This is major deficiency in the consideration of the Traffic Light System.
Tables 1-4 show the considerable variation in sampling in each production area but these tables refer to the number of fish caught not the size of the sample. Figure 5 shows the number of fish caught in each of the sampling occasions across all production areas during 2023.
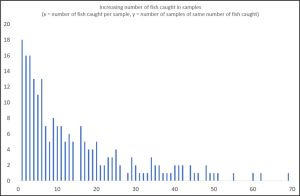
Figure 5: Number of samplings to catch increasing numbers of fish.
In total, there were 217 samplings undertaken in 2023. The smallest number of fish caught was just one and the largest was 131 fish although this sampling is not included in Table 5. 18 (8%) of the samplings caught just one fish. Samplings for two and three fish were both 16 in number but the number of samplings fell as the number of fish increased. The majority of fish caught were in very small numbers. Taranger et al. (2012) recommended a sample size of 100 fish. To achieve this by amalgamating all the most common samplings would require all the samplings of 8 or under fish. However, it is unlikely that a sample of 100 fish made up from all the samplings for 1,2,3 and some of those catching 4 fish would be the same as one sample of 100 fish. There is no guarantee that one sample of more than 100 fish reflects the true nature of sea lice infestation. There needs to be many such samples.
In some countries, such as Scotland, the recommended minimum number of fish in a sample is set at 30 fish. This number is thought to have come from the Central Limit Theorem (CLT) for which a sample size of 30 is suggested. However, the Central Limit Theorem applies to normal distributions rather than those which are aggregated. Even if a sample of 30 was acceptable for measuring sea lice infestation, then only 16% of the samples obtained in 2023 would meet that criteria.
The number of host fish sampled by NALO in each sampling has been shown to be very low and the resulting distributions are not reflective of an aggregated distribution where most hosts are either lice free or have a very low numbers of lice. This may be because small samples may be of weaker or more highly infested fish which are easier to catch. Thus, the sampling may be emphasising fish with higher lice counts which are skewed towards the right hand side of the graph of an aggregated distribution as shown in figure 6.
Figure 6.: Smaller samples may be selectively catching host fish with higher lice counts leading to unrepresentative presentation of parasite distribution.
However, it may not be just small samplings that has affected the failure to adequately represent the aggregated distribution of parasitic sea lice. NALO uses two methods of fish capture, nets (Garn) and traps (Ruse). The Expert Group report that traps are the preferred method of capture as the fish can be released live. However, traps are a more passive method of capture and because of the close proximity to the coast may attract host fish with higher lice counts.
Table 5 shows the number of fish caught by net and trap in each location within all 13 production areas. There appears to be no consistency as to whether nets or traps are deployed in any location. If traps are the preferred method of capture , then why are they not used exclusively in the NALO sampling rather than using both methods. Several locations use only traps whilst others appear to use just nets.
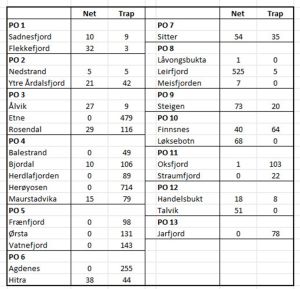
Table 5: number of fish caught by net and trap at each location in all 13 production areas.
The locality of Hitra appears to have about equal numbers of fish sampled by nets and traps with both being used throughout the sampling period. Comparison of the results of both sampling methods would indicate that nets provide a better representation of lice distribution than host fish sampled by traps. Figure 7 compares the sea lice distribution on host fish sampled at similar times at Hitra using nets and traps. The number of host fish sampled is small, but nets sampled host fish with lice infestations from zero to 37 lice whilst the traps sampled host fish with lice infestations from zero to 121 lice. The higher levels of infestation are not shown on the graph but include six additional fish with infestations ranging from 52 to 121 lice.
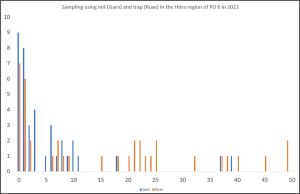
Figure 7: Sea lice distribution on host fish sampled by nets (blue ) and traps (orange).
The results of the comparison between traps and nets are reflected in a similar study undertaken in Scotland (unpublished).
Taranger Index of Mortality
The beginning of this document highlighted that section 2.2 of the Expert Group’s report states that the number of lice per gram of fish weight is used to estimate the probability that a migrating salmon post smolt will die from sea lice. Taranger et al. (2012) proposed limit values for fish of less than 150g that all will die if the lice load is in excess of 0.3 lice per gram. A slightly modified formula applies to fish of over 150g.
Using Taranger’s formula, it has been possible to calculate the expected mortality of fish in each of the production areas based on the samples of fish caught during the NALO process. The results are shown in Table 6.
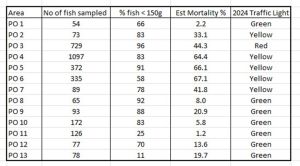
Table 6: Taranger index (Estimated mortality) for all production areas in 2023. The number of fish sampled and the percentage of fish under 150g is also shown.
The assignment of the Traffic Light System values by the Expert Group has thrown up some clear anomalies, most notable is that PO 3 is designated as a red (high) risk area yet the estimated mortality is 44.3% whilst, PO 4 64.4%, PO 5 66.1%, and PO 6 67.1% are all higher but have been assigned a moderate (yellow) risk. PO 7 at 41.8% has an estimated mortality close to that of PO 3 yet is also of moderate (yellow) risk. The Expert Group define the Traffic Light System values as:
Less than 10% mortality = low (green)
Between 10 and 30% mortality = moderate (yellow)
Over 30% mortality = high (red)
Thus the Traffic Light System values based on the estimated mortality calculated by the Taranger index from the samples obtained through NALO 2023 are shown in Table 7.
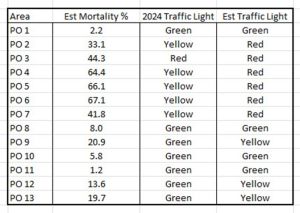
Table 7: Revised Traffic Light System values based on NALO sea lice data 2023.
It can be seen that using the Expert Group’s methodology that only five of the 13 production areas have the same assignment as that published by the Expert Group. The other eight should have a higher assignment than as given by the Expert Group.
However, these higher ratings assume that the sampling is actually representative of the lice infestation of the wild fish population. The analysis of the samplings would suggest that they are not, and thus the assignments shown in Table 6 are actually invalid.
When considering the infestation pressure of sea lice on wild fish and the alleged association with salmon farms, it is also necessary to consider the number of salmon farms in each production area. Salmon farm licences are recorded by the Fisheries Directorate and at the time of writing the 2023 data had not been published. Table 8 highlights the number of licences for each production area.
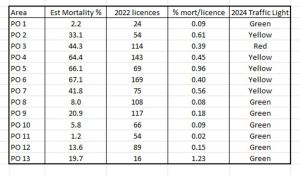
Table 8: 2022 salmon farm licences per production area. Estimated mortality and estimated mortality per licence are also listed.
Most of the discussion in the wider media regarding sea lice infestations relates to production areas 3 and 4, yet it is PO 6 which has the highest number of salmon farm licences.
The Steering Group’s assessment[10] lists the assignment for each production area for the eight years since 2016 when the Traffic Light System was first proposed. Five of the thirteen areas have more than 100 licences.
PO 3 – 7 years high, 1 year moderate
PO 4 – 4 years high , three years moderate
PO 6 – 3 years moderate, 5 years low
PO 8 – 1 year moderate, 7 years low
PO 9 – 8 years low
Even though all these production areas have more than 100 salmon farm licences, the sampling in 2023 ranged from 5 weeks to 50 weeks equivalent and sampled between 65 and 1097 fish.
Based on the number of licences and the estimated mortality, an index of percentage mortality per licence has been calculated and shown in Table 8. These range from 0.08 for PO 8 to 1.23 for PO 13. The production areas with the highest number of licences all have an index of between 0.39 and 0.45 which suggests that the association between salmon farms and wild fish may not be as clear cut as the Traffic Light System would suggest.
Interestingly, there is another source of farm data – Barentswatch[11] which indicates a different number of licences for each production area (Table 9)
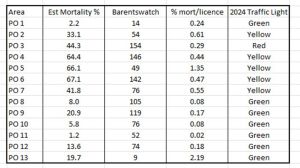
Table 9. Salmon farm licences from Barentswatch shown in a similar format to Table 8.
Quantifying parasites in samples of hosts.
Determining the impact of sea lice on wild fish for the Traffic Light System is currently undertaken using the Taranger index and this was developed specifically to quantify the loading of this sea lice on wild salmon and sea trout. There are thousands of other parasites in the world and researchers use a different approach to quantifying the levels of parasites on their hosts. These have been defined by Bush (1977)[12] and include:
Prevalence – The percentage of the hosts in the sample that are infected by the parasite.
Abundance – The average number of parasites per host in the whole sample.
Intensity – The average number of parasites per host of hosts that are infested with the parasite.
In their annual assessment of salmon lice infestation for 2023[13] the Institute of Marine Research write in a section titled ‘Estimation of infection pressure and mortality’ that all infection parameters are calculated and described according to recommendations from Rozsa et al. (2000)[14] IMR rely on calculations of only prevalence and intensity and their document includes tables showing the outcomes for these parameters for salmon and sea trout caught by a variety of methods over a period of weeks at various locations in all 13 production areas. Table 10 shows the recalculated cumulative results for the 13 production areas including the measure of abundance, which IMR did not include.
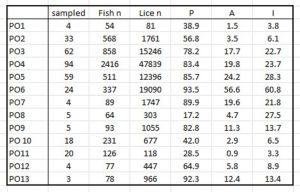
Table 10: Total Prevalence (P) Abundance (A) and Intensity (I) for 13 production areas. Table includes total number of fish sampled, the number of samplings, and the total number of lice.
In theory, comparison of the calculated values for each production area should allow an assessment of whether the area has high or low infestation. However, Rozsa et al (2000) do not refer to the influence of sample size and nor do IMR. It is extremely questionable whether abundance or intensity for the 13 production areas can be realistically compared when the number of fish sampled varies from 54 to 2,416 fish. Equally the number of samplings that has led to such a wide variation in host numbers ranges from 4 to 94. Such variations can lead to some clear anomalies. These are apparent from the data in Table 11
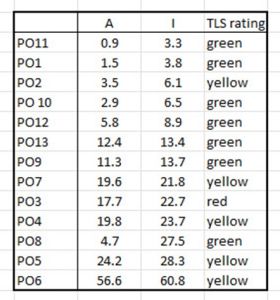
Table 11: Abundance (A) and Intensity (I) of lice infestation together with Traffic Light rating for all 13 production areas. Production areas are listed in order of increasing lice intensity (I). The Traffic Light System rates infestation in terms of low (green) moderate (yellow) and high (red).
It may be expected that as the intensity increases, the colours should change accordingly but using the 2023 data, they have not. There are clear anomalies arising from this data:
- PO 2 has been assigned a moderate (yellow) rating even though PO 10 , PO 12, PO 13, PO 9, and PO 8 all have higher infestation intensities.
- PO 3 has been assigned a high (red rating) even though PO 4, PO 5 and PO 6 have been assigned a moderate (yellow ) rating even though lice intensities are much higher. This is also true for PO 8 which has been given a low (green) rating.
- IMR have chosen to omit abundance from their calculations. This means that host fish carrying no lice are excluded. PO8 has high intensity but low abundance.
Table 12 shows increasing abundance rather than intensity which effects the order of perceived risk to the production areas.
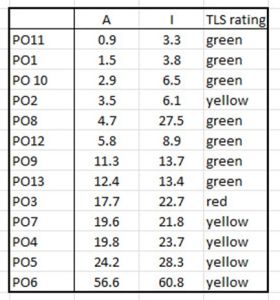
Table 12. Production areas rated in order of increased lice abundance showing the comparative rating for the Traffic Light System.
If the level of infestation measured by intensity is related to the number of salmon farms in any area, it might be expected that the more farms, the higher the intensity. The relationship between salmon farm licences and sea lice infestation as expressed by intensity is shown in Table 13.
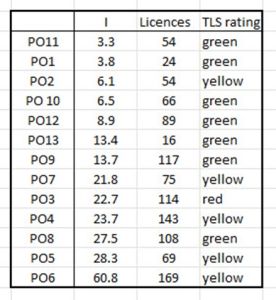
Table 13, Relationship between number of salmon farms and sea lice infestation as measured by intensity.
Although production areas with the least salmon farm licences do have lower intensities of sea lice infestation, the relationship is not clear cut. There are areas such as PO 5 that has a small number of licences but a high intensity and areas with large numbers of farms such as PO 9 that have more moderate levels of infestation as measured by intensity.
Sampling
The variation in sampling was previously discussed in relation to quantifying parasite infestation. In 2023, the number of samplings ranged from 4 to 94 and the number of host fish sampled from 54 to 2416 across all 13 production areas.
According to Greig-Smith (1983)[15] the value of quantitative data depends on the sampling procedure and ultimately on sample size, a point reiterated by Poulin (1998)[16]. Poulin adds that estimates of parasite infestation improves with increased sampling such that the sample values increase towards real population values as the host sample size increases.
Poulin also suggests that prevalence is affected by sample size and certainly some of the examples of high values up to 100% that appear in the IMR document are associated with small samples. Sample size was discussed towards the beginning of this document in relation to recommendations made by Canadian government scientists [17].
Salmon trawls
In 2023, trawling for salmon smolts took place in six fjord systems over just five production areas. Trawling did not occur in PO 1, PO 6, PO 7, PO 8, PO 9. PO 11, PO 12, and PO 13. According to the Experts Group report, two of the fjords are new for 2023. These are Nordfjorden in PO 4 and Vågsfjorden in PO 10. Previously trawling had taken place in Trondheimsfjorden (PO 6) and Altafjord (PO 13). No explanation was supplied as to why these changes were introduced.
PO 2 Boknafjord
The Expert Group say that estimated mortality increases from low to high throughout the trawling period, the IMR data shows that whilst prevalence increased to 86% in the third of four weeks of trawling, the mean number of lice per fish was only 4 lice per fish. That week the trawls caught 243 fish. The fourth week, when intensity increased to 23 lice per fish, the trawls caught just three fish. However, the measure of intensity ignores fish that are not infested with lice.
The Boknafjord data can be broken down to show the number of fish caught on each day during the four week trawling (Table 14). Most trawls caught very few fish and it is questionable whether such small samples have any meaning. During the last week, a total of five fish were caught of which one was a trout, which had no lice. The fourth fish was also lice free.
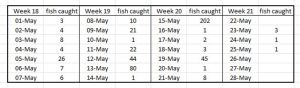
Table 14: Number of fish caught during daily trawling of Boknafjord for salmon smolts.
When the number of lice per fish is plotted, about 45% of the 504 fish are lice free (Figure 8) About 97% of the fish have lice infestations of less than 10. This does not suggest a moderate mortality.
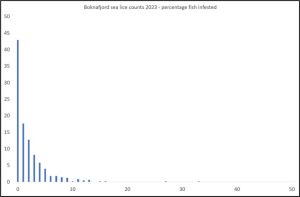
Figure 8: Percentage of fish with increasing numbers of lice in Boknafjord.
Of these lice, 93% were copepodids, 5% chalimus I, 1.4% chalimus II, 0.6% preadult and 0.1% adult female.
Using the Taranger index, estimated mortality is 14.5%, however only one sample exceeds the minimum requirement for sample size according to Taranger et al. (2012).
PO 3 Hardangerfjord
The Expert Group report say that the lice induced mortality was low for the first two weeks and high for the second two weeks but high for the whole period, They say that catches were low but the largest catch was for the middle two weeks. However, they fail to mention that these catches were just 46 and 34 fish fish respectively.
The size of the samples is shown in Table 15.
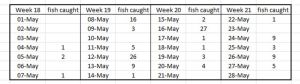
Table 15: Number of fish caught during daily trawling of Hardangerfjord for salmon smolts.
The largest sample size was just 27 fish. Only 130 fish were sampled in total.
The percentage infestation of increasing numbers of lice is shown in Figure 9.

Figure 9. Percentage of fish with increasing numbers of lice in Hardangerfjord.
Just under 45% of the fish were lice free. There were small numbers of host fish carrying up to 50 lice.
Of these lice, 63% were copepodids, 27% chalimus I, 4.8% chalimus II, 2.0% preadult, 1% adult males and 1.4% adult female.
Using the Taranger index, estimated mortality is 29%, however not one sample exceeded the minimum requirement for sample size according to Taranger et al. (2012).
Although this analysis has not taken the following data from the IMR dataset, the PO3/PO4 Knowledge Incubator have compared the trawl data with the average farm lice counts in Hardanger fjord. Table 16 shows both sets of data from 2012 to 2023. The trawl data ranges from 0.59 to 20.92 lice whilst the farm data runs from 0.01 to 0.12 lice. There appears to be no relationship between the two sets of data which questions the assertion that farms are directly related to high lice counts on wild fish.
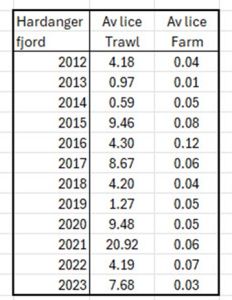
Table 16. Average lice counts from trawls in the Hardanager fjord compared to average lice counts form nearby salmon farms from 2012 to 2023.
PO 4 Sognefjord
The Expert Group report appears to have combined the data from both Sogne- and Nord- fjords but here they will be treated separately. They say that the catch was poor in the first two weeks (a total of 12 fish) so low mortality was estimated although how it is unclear how they can arrive at this conclusion from so few fish. The estimated mortality then increased from moderate to high. Mortality was estimated as high for the whole trawl period.
The sample size for Sognefojord increased to 388 fish for week 21 and 229 for week 22. The breakdown of sampling is shown in Table 17.
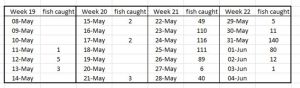
Table 17. Number of fish caught during daily trawling of Sognefjord for salmon smolts.
For of the sample trawls were over the 100 fish Taranger minimum, however, it is unclear how many separate trawls it took to collect these fish.
The percentage infestation of the whole sample is show in Figure 10.
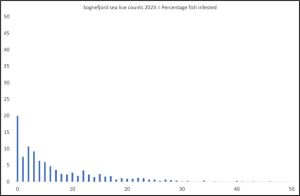
Figure 10. Percentage of fish with increasing numbers of lice in Sognefjord.
The percentage infestation is low in Sognefjord at around 25%. In addition, about 25% of the fish have infestations over 10 lice.
More fish have chamilus I infestations than copepodid. Of these lice, 16% were copepodids, 70% chalimus I, 14% chalimus II, 1.2% preadult, 0.07% adult males and no adult females.
Using the Taranger index, estimated mortality is 40%,
During week 21, three trawls exceded the Taranger 100 minimum sample size. These three were combined to produce a sample size of 337 fish and the lice infestation was plotted against the whole sample (Figure 11).
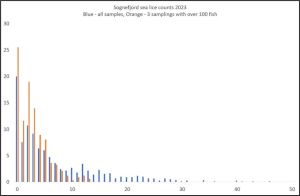
Figure 11. Percentage of fish with increasing numbers of lice in Sognefjord. Blue bars are total sample. Orange bars are the three samples in Week 21 over 100 fish each.
It can be seen that the percentage of lice free fish increased from 20% to 25% with the increased sample size. More critically, the range of lice infestation fell. Less fish with high lice infestation were caught suggesting a more representative sample from these larger samples
The lice infestation was also different with 49% copepodids, 45% chaminus I and 5% chalimus II. No other lice lifes stages were present.
Using the Taranger index, estimated mortality is 17%, This is down from 40% for the whole sample.
Although this analysis has not taken the following data from the IMR dataset, the PO3/PO4 Knowledge Incubater have compared the trawl data with the average farm lice counts in Sognefjord. Table 18 shows both sets of data from 2012 to 2023. The trawl data ranges from 0.07 to 24.89 lice whilst the farm data runs from 0.04 to 0.17 lice. There appears to be no relationship between the two sets of data which questions the assertion that farms are directly related high lice counts on wild fish.
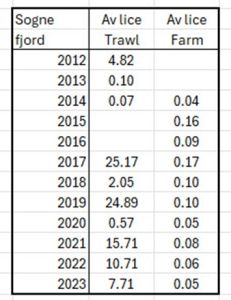
Table 18. Average lice counts from trawls in the Sognefjord compared to average lice counts form nearby salmon farms from 2012 to 2023.
PO 4 Nordfjord
For Nordfjord, the Expert Group report that the catch was generally good, especially for the first three weeks (of four). The estimated mortality was assessed as low to high in the first three weeks and then low in the last week with an overall moderate mortality.
Table 19 shows the actual sampling for Nordfjord.
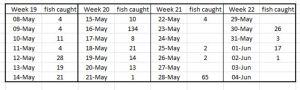
Table 19 Number of fish caught during daily trawling of Nordfjord for salmon smolts.
The sampling shown in Table 19 contradicts the view of the Expert Group with only one good day’s sampling which occurred on May 16th. All other sample trawls produced low numbers of fish. The percentage infestation is shown in Figure 12.
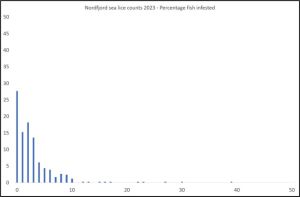
Figure 12 Percentage of fish with increasing numbers of lice in Nordfjord.
Nearly 30% of the fish are lice free and 97% of fish have an infestation of less than 10 lice. This would suggest a relatively low mortality rather than the moderate mortality proposed by the Expert Group.
More fish have chamilus I infestations than copepodid. Of these lice, 4.3% were copepodids, 62% chalimus I, 24% chalimus II, 8% preadult, 1.8% adult males and 0.1% adult females.
Using the Taranger index, estimated mortality is 23%.
PO 5 Romsdalsfjord
The Expert Groups assessement of estimated lice mortality in Romsdalsjord was high in the first week dropping to low then increasing again to high by the fourth week. However the two weeks of high mortality are based on samples of just 5 and 7 fish respectively. Overall, the estimate for the whole period is moderate. Table 20 shows the daily catches of fish during the trawling period.
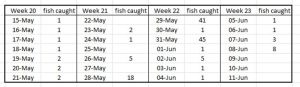
Table 20. Number of fish caught during daily trawling of Romsdalsfjord for salmon smolts.
Figure 13 shows the percentage of infested fish with increasing lice infestation with 90% of the fish carrying 10 or less lice.
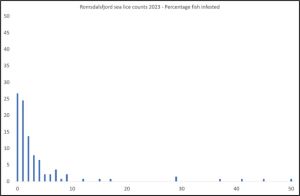
Figure 13 Percentage of fish with increasing numbers of lice in Romsdalsfjord.
More fish have chamilus I infestations than copepodid. Of these lice, 14.6% were copepodids, 52.5% chalimus I, 18.6% chalimus II, 13% preadult, 1.3% adult males and 0.1% adult females.
Using the Taranger index, estimated mortality is 24%.
PO 10 Vågsfjord
The Expert Group report that catches were low and salmon were caught only in the first three weeks. (Trout were caught in the last week). The assessement is that the mortality is low. The largest number of fish caught was 18 (table 21).
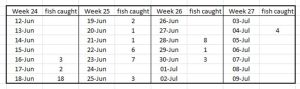
Table 21. Number of fish caught during daily trawling of Vågsfjord for salmon smolts.
Figure 14 shows that the majority of fish (70%) caught in Vågsfjord were lice free.
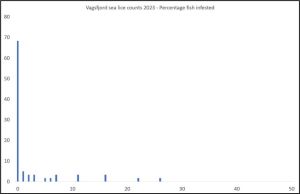
Figure 14. Percentage of fish with increasing numbers of lice in Vågsfjord.
More fish have chamilus I infestations than copepodid. Of these lice, 4% were copepodids, 36% chalimus I, 21% chalimus II, 33% preadult, 6% adult males and 0.1% adult females.
Using the Taranger index, estimated mortality is 3% based on the very small numbers of fish caught.
Sentinel cages
According to the Institute of Marine Research (IMR) report, sentinel cages of 1m3 were anchored from 0.5 to 1.5 m depth at fixed stations (Bjørn et. al. 2011)[18]. Aprroximatley 30 fish are stocked in each cage, yet as these are farmed fish which were readily available, then exactly 30 fish were stocked. Presumably the reason why the word ‘approximately;’ is used is because when the fish were recovered, the numbers from the cages ranged from just 13 fish in at least two cages to all 30 in several. The loss of fish during the two week period of the assessment is not explained. Overall, sentinel cage fish suffered a 17% mortality in just 14 days.
IMR state that because farmed smolts are much larger than those found in the wild, infestation pressure is measured by the number of lice on the fish rather than the number of lice per gram of fish.
The limits used were:
Less than 2 lice per fish = low
Between 2 -6 lice per fish = moderate
More than 6 lice per fish = high
The Expert Group say that normally, 18-20 sentinel cages are deployed in each fjord system. In fact, whilst 18 cages were deployed in Hardangerfjord but only 16 were recorded in Sognefjord.
Fish were stocked in cages twice over two periods of 14 days each. In Hardangerfjord, the two week periods were 16-17 May to 30 May and then 30-31 May to 13 June. In Sognefjord, the cages were deployed from 18 May to 2 June and then 2 June to 14 June.
Hardangerfjorden
In Hardangerfjord, the cages were deployed as shown in figure 15.
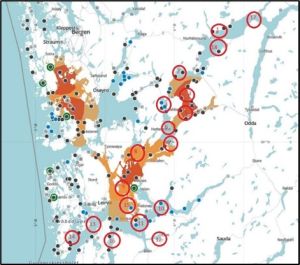
Figure 15. Dots – farms Red circles – sentinel cages.
Table 22 shows the various lice counts from each sentinel cage deployed in Hardangerfjord. The majority of lice are chalimus stages. The number of fish recovered is also recorded. The mortality was approximately 20%.
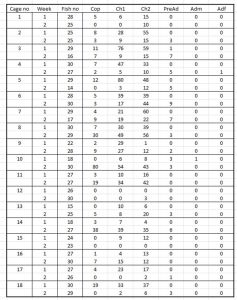
Table 22. Lice counts from sentinel cages deployed in Hardanger fjord including copepod, chalimus pre-adults and adult male and female lice. ‘Fish no’ is the number of fish recovered.
The total lice counts have been classified here as either low or high and have been plotted on the map used in figure 14 with low counts in green and higher counts in red. Figures, 16 and 17 cover the two 14 day periods.
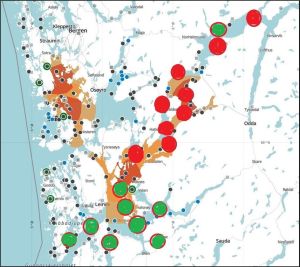
Figure 16. High (red) and low (green) lice counts in sentinel cage fish Hardangerfjord 16-17 May to 30 May 2023
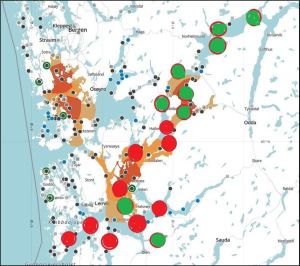
Figure 17. High (red) and low (green) lice counts in sentinel cage fish Hardangerfjord 30-31 May to 13 June 2023.
The sentinel cages are deployed between many different farms throughout the Hardangerfjord. A complete analysis of the lice counts of every farm at this time would be a major undertaking but as the Expert Group state that the data is not used to assess lice infestation but rather as a comparison of lice in space and time.
Figure 18. shows the same assessment from IMR in their assessment report.
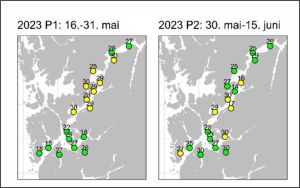
Figure 18. IMR analysis of infestation of salmon held in sentinel cages in Hardangerfjord for two fortnight periods in 2023. Green – lice number less than 2. Yellow- lice number 2-6 per fish.
The maps are very similar although this analysis uses total number of lice rather than specific infestation levels per fish.
The Irish Marine Institue have described the life cycle of sea lice (Lepeophtherius salmonis)[19] in which they state that planktonic nauplii hatch directly from the egg string whilst still atatached to the female louse. Development is temperature dependent but typically, the two naupliistages could take around 2 days at average tempertaures. The nauplii moult into a free swimming infective copepodid stage which could take a week at average temepratures. The first chalimus stage could last 10 days and the second 15 days. Even if water temperatures were elevated and development was quicker, this could not explain the change from week one to week two as observed in Hardangerfjord.
A page on the IMR website is devoted to sea lice[20]. This states that dispersal of sea lice occurs because free swimming stages spread with the currents in fjords and along the coast. However, back in 1997 Boxaspen (Now Deputy Director General of IMR [21]) was unable to find any larval sea lice in the waters around Austevoll Aquaculture Research Station[22] . An Irish study, the previous year, also failed to find larval lice in open water so the authors searched at increasing distances from a farm with a sea lice infestation. They found that whilst high lice concentrations were identified next to the farm, these had become so dilute within 1 km of the farm that they were difficult to measure. [23].
Their graph of sea lice densities at increased distance from the farm is shown in figure 19.
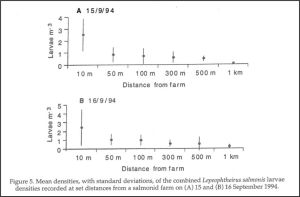
Figure 19. Taken from Costelloe et al. 1996 (ref 23).
A more recent study by Nelson et. al. (2017) found sea lice larvae fell from 1.4 larvae/m3 to 0.4 larvae /m3 within 100 metres of the farm[24]. Figure 20 shows Nelson et al’s (2017) results.
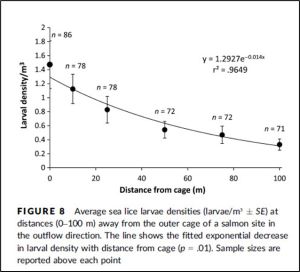
Figure 20: From Nelson et. al. (2017). Ref 24.
It is clear from a very small number of studies that larvae sea lice soon become extremely dilute in the open water and represent almost no risk to wild fish as the chance of one larvae encountering one fish is so small.
The assumption by the scientific community, as illustrated by the account that appears on the IMR website, is that lice larvae are released from eggs attached to female lice living on farmed salmon. These lice larvae then are carried in large numbers by wind and currents down the fjord system where they encounter and infest wild fish. As the studies by Costelloe et al. (1996) and Nelson et al (2017) demonstrate, lice larvae are quickly diluted by the large volumes of water. This makes the IMR account invalid. If fish held in sentinel cages do become infested with lice, then the route of infestation must be different.
The first possibility is that the sentinel cages are located close to an active farm, in which case lice larvae may still be present in open water in sufficient numbers to infest the fish held in the small area of the sentinel cage.
Alternatively, the fish in the sentinel cages become infested from existing lice infestations on wild fish as they swim by. There is evidence that sea trout can lose lice. A fish recaptured in north West Scotland was found to have significantly less lice five week after first capture as shown in figure 21
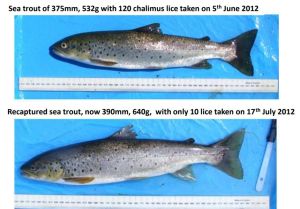
Figure 21. Sea trout caught in north west Scotland.
In addition, large salmon returning to Scottish rivers have been found to have been infested with the early life stages, which can only have come from fish to fish transfer as the likelihood of becoming infested with free swimming stages whilst out in open sea must be considered remote.
Using the formula discussed at the beginning of this section whereby lice infestation in sentinel cages is measured by the number of lice rather than as a function of the fish weight, the estimated sea lice infestation of fish kept in sentinel cages in the Hardangerfjord would be:
Low – 52%
Moderate – 44%
High – 4%
When sea lice are plotted as percentage infestation with increasing number for all the fish from Hardangerfjord sentinel cages, the distribution is shown in figure 22. The majority of fish clearly have no lice or a low lice count and therefore are not at risk.
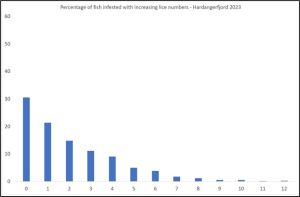
Figure 22. Percentage sea lice infestation with increasing lice counts from sentinel cages in Hardangerfjord 2023.
Sognefjorden
The location of the sentinel cages deployed in the Sognefjorden are shown in figure 23. Cage number 7 did not produce any results and there was no cage 18.
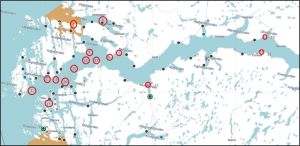
Figure 23. Location of sentinel cages (red circles) deployed in Sognefjord in 2023. Location of farms are represented by a dot.
Table 23 shows the various lice counts from each sentinel cage deployed in Sognefjord. The majority of lice are chalimus stages. The number of fish recovered is also recorded. The mortality was approximately 20%.
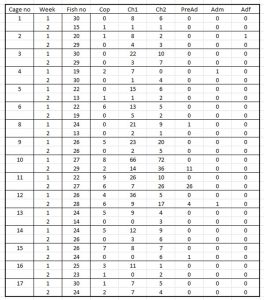
Table 23. Lice counts from sentinel cages deployed in Sognefjord including copepod, chalimus pre-adults and adult male and female lice. ‘Fish no’ is the number of fish recovered.
The total lice counts have been classified in this analysis as either low or high and have been plotted on the map used in figure 23 with low counts in green and high counts in red. Figures, 24 and 25 cover the two 14 day periods.
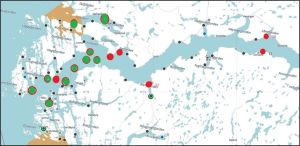
Figure 24. High (red) and low (green) lice counts in sentinel cage fish Sognefjord 18 May to 2 June 2023.
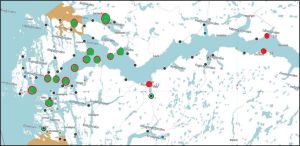
Figure 25 High (red) and low (green) lice counts in sentinel cage fish Sognefjord 2 June to 14 June 2023.
The pattern of infestation in Sognefjord is very different to that of Hardangerfjord. Three cages are of a higher infestation in the first week but then have a lower infestation, like all those around them, in the second week. The three sentinel cages of most interest are those in the upper reaches of the fjord. These all have a high lice count during both deployments, The two cages highest up the fjord appear to be higher up than any farm and presumably upstream of any currents. The third sentinel cages also shows higher infestation throughout all four weeks. The location of all three sentinel cages appears close to shore and possibly near a river mouth where in the wild, sea lice exchange is thought to occur. Naturally occurring lice would be expected to be active at the time of the wild smolt migration.
Figure 26 shows the IMR assessment of the infestation pressure for sentinel cages in Sognefjord as a comparison to figures 24 and 25.
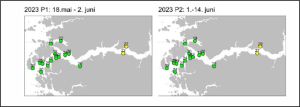
Figure 26 IMR analysis of infestation of salmon held in sentinel cages in Sognefjord for two fortnight periods in 2023. Green – lice number less than 2. Yellow- lice number 2-6 per fish.
Using the formula discussed at the beginning of this section whereby lice infestation in sentinel cages is measured by the number of lice rather than as a function of the fish, the estimated sea lice infestation of fish kept in sentinel cages in the Sognefjord would be:
Low – 76%
Moderate – 23%
High – 1%
When sea lice are plotted as a percentage infestation with increasing numbers for all the fish from Sognefjord sentinel cages, the distribution is shown in figure 27. The majority of fish have no lice or a low lice count and therefore are of little risk of sea lice infestation.
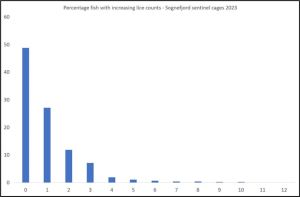
Figure 27. Percentage sea lice infestation with increasing lice counts from sentinel cages in Sognefjord 2023.
Use of models
The Expert Group state that in addition to the observational data, they use the results from models that calculate the distribution of salmon lice in space and time along the entire coast. These models cover the entire area of each production area throughout the time salmon smolts migrate to sea. The models therefore indicate whether the observations are representative, i.e. that the observed fish have experienced higher or lower infection pressure than is typical for migrating smolts in each production area in the given year.
The fundamantal question is why does the Expert Group require three models, one from IMR, one from the Veterinary Institue and one from SINTEF, to assess the infesttaion pressure for the Traffic Light System. Presumably the simple answer is that none of them can actually be relied on to provide an accurate assessment of infestation pressure.
Table 24 compares the percentage infestation pressure from each of the three models for each production area.
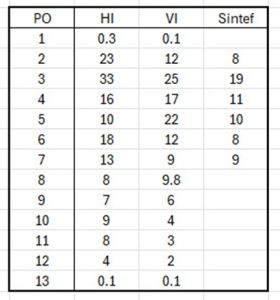
Table 24: Percentage infestation pressure for each production area as estimated by the three models (from the Expert Group report).
There is significant variation between the output from the three models especially in PO 3 and PO 4 which are claimed to be the production areas with the largest sea lice problem. The question is how can there be such a significant difference if they all evaluate the same sea lice pressure in the same production area?
Hastein amd Bergsjo (1976)[25] published one of the first scientific papers on sea lice infestation in farmed salmon. It is now 48 years since that paper was published, and whilst hundreds of papers have been published since, mainly about sea lice and salmon farming, there is very little understanding of the nature of the ecology of sea lice in the wild. Yet, sea lice are still a wild organism and their behaviour and ecology will still impact on how they infest both farmed and wild salmon.
Parasites tend to be extremely specialist when it comes to finding a host. They tend not to use a scattergun approach but prefer to maximise the likelihood of locating their host species, whether they have just one or multiple hosts in their lifecycle.
On example of the complexity of parasitism is the trematode worm, Schistosoma spp which causes the disease schistomiasis in humans and affects over 225 million people with up to 200,000 dying from the effects every year. The life cycle is shown in figure 28 from the Centre of Disease Control[26]
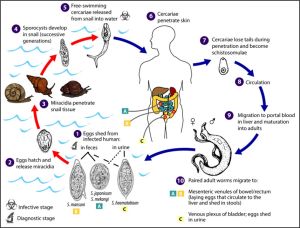
Figure 28 Life cycle of the trematode Schistosoma spp (CDC)
The sea louse infesting salmon is one of 162 of Lepeophtheirus spp. Thee are estimated to be around 50 different species of Lepeophtheirus spp found in the seas around the UK. One of the species that is more widely known is L. pectoralis which infests flatfish including plaice, flounder and dab.
The life cycle of L. pectoralis consists of five phases and 10 stages. The first two stages are free swimming nauplius with the third stage being the infectious copepodid. There are four chalimus stages followed by pre-adult and adult stages with both male and female adults[27].
Boxshall (1976) went on to describe the infection process for L. pectoralis[28].
The infection process is divided into a host location phase during which the copepodid enters the habitat of the host and locates a host individual and an attachment phase during which the infection if effected. Boxshall (1976) says that the two phases are controlled by different behavioural responses of the infective larvae.
The copepodid is positively phototactic but after an initial post-moult period of swimming activity , it becomes relatively inactive and tends to sink to the bottom. This behavioural change comprises the first part of the host location phase as it brings the copepodid into the habitat of the flatfish hosts near the sea bed.
The resting copepodid is stimulated into bursts of swimming activity by sudden changes of light intensity and water turbulence. It exhibits a positively rheotactic response when exposed to a directional water current. It seems that the copepodids move towards the water currents produced by the host fish typically by the respiratory movements. Copepodids were found to settle on the host near the gills and around the fins both which cause water movement.
For salmon lice, both physical and chemical cues are considered important in host location and such cues may enable larval lice to gather in areas where host fish are likely to be found[29].
The question is where are these areas where host fish are likely to be found that sea lice may gather. Costelloe et. al. ((1998) found larval sea lice close to the mouths of two rivers as well as two other estuarine locations in which no farms were located[30]. Pert et. al. (2014) found salmon stocked in a sentinel cage located close to the mouth of the river Shieldaig even through this sentinel cage was located furthest from a salmon farm[31]. These studies may suggest that the site of host location is the river interface with the sea where smolts slow down in their migration to acclimatise to the new saline environment.
L. perctoralis has also been shown to infest host fish through the movement of adults from other fish. However, Anstensrud (1990) found that a larger percentage of adult male L. pectoralis were more likely to transfer to another host fish if females were present than to uninfected fish.[32]
The ability for sea lice to move from one host fish to another has also been observed with salmon lice. Bruno & Stone (1990)[33]. This occurred at a low rate and involved mainly pre-adults and some adult males. Transfer of mobile lice also occurred between salmon and saithe.
Despite forty years of sea lice research, there appears little evidence to support the view that sea lice actively use dispersal by wind and currents as an aid to host location.
The Expert Group state that all three models calculate distribution of infectious sea but the three models use different approaches to spread larval sea lice along the coast. However, all three cannot be correct (or based on the limited evidence, all three may be incorrect). The Expert Group say that IMR and SINTEF use hydrodynamic models that although the methods of waterborne transport is the same, the models are not. The VI model assumes that the density of sea lice decreases with distance from a farm. It is unclear whether any of these models have been validated by identifying larval sea lice in the open water where the models predict they should be. Instead, it seems that the models have been validated against the sentinel cage and trawl data, even though as previously discussed, the sampling used has been generally poor.
The Expert Group described the three models they use.
IMR Model
The Expert Group describe various aspects of the hydrodynamic and particle models in which the spread of sea lice by current which uses reported data on the number of lice and the number of fish from all reportable aquaculture facilities to calculate the number of newly hatched larvae. Sampling of salmon farms pens in Norway involves a maximum of twenty fish at peak migration times and ten fish at other times. However, Bron et al. (1993) found that sea lice larvae were highly overdispersed over the host fish at a salmon farm[34]. They found one fish with 479 lice whereas the average number was just eight. As the host fish carry lice in an overdispersed distribution, the number of sea lice produced as predicted by models can be significantly overstated.
The Expert Group also state that the end product of the particle dispersion model as the distribution of infectious copepodites in the fjords and along the coast hour by hour which gives a detailed overview of the areas that have a lot or little salmon lice larvae. They cite the example of a copepodite density map in the IMR report ‘Modelled impact of salmon lice on wild salmon 2013’[35] (Figure 29).
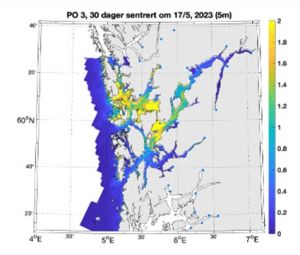
Figure 29. IMR copepodite density map PO 3
There are various reports for sea lice assessment during 2023 but there appears to be no mention of validation of the model by planktonic trawling for lice in the predicted high lice areas such as those in yellow. It should be a relatively simple process to match the larval lice predictions with numbers of larval lice caught in the affected areas. Clearly, if no larval lice can be found then the model is wrong.
IMR also run a virtual post smolt model to quantify how many copepodites a virtual salmon post smolt acquires when it swims through a modelled louse concentration. This ignores the fact that sea lice are spread on host fish as an aggregated distribution. IMR have calibrated this against the number of lice on trawled post smolts however, as the sampling data is extremely poor and unrepresentative of lice distribution on host fish.
VI Model
The VI model is similar to that from IMR but uses four models – infection pressure, infestation and regression, emigration and mortality. The main difference is that the prediction of the spread of larvae includes allowance for decreasing concentration although the VI document provided as part of the Expert Group report does not appear to include any explanation of how this is applied.
SINTEF model
The Expert Group say that the model uses the most realistic input data possible (data from IMR) with both a hydrodynamic and particle dispersal elements. SINTEF have assessed the validity of their model by comparing the predictions with both sentinel cage and trawl data covering 2019 to 2023.
Figure 30 shows the SINTEF validation of their model by comparing the observational data from sentinel cages with their model data.
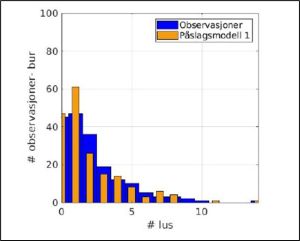
Figure 30. Comparison of the observation data from sentinel cages (2019 to 2023) (blue) with the model data (orange).
SINTEF say that the model over-estimates fish infestation with one lice and underestimates fish with lice numbers above 8. The average lice infestation of the observed data is 2.5 whereas the model estimates 2.1 lice per fish.
SINTEF also compare the model with the trawled data for the same period (Figure 31).
Figure 31. Comparison of trawled data (black) with model (orange) 2019 to 2023.
SINTEF says that the model does not agree with the observed data especially with infestation of both zero and one louse. The mean value is 8.5 lice per fish for the model and 4.8 lice for the observational data.
What SINTEF have failed to realise is that the distribution shown in the observational data is of an aggregated distribution and what would be expected with data covering a large number of samples as in this example covering five years. Whilst a reasonable fit might be expected over such a large sample, it is questionable whether the model would be able to predict a true representation of infestation pressure.
SINTEF say that the model does not appear to reflect the observations of sentinel cages in Sognefjord which should be cause for real concern.
Uncertainties
The Expert Group include a section on ‘uncertainties’ in their report.
The Steering Group state that a section of the uncertainties in their report is part of the mandate of the Expert Group. The Expert Group have discussed a number of different areas where they believe uncertainties might exist such as the salmon smolts tolerance limits for sea lice infestation level. However, the uncertainties that exist extend far beyond such minor issues. It could be said that the whole narrative about the impact of sea lice on wild fish is uncertain since there is little hard evidence to link sea lice to the decline in wild fish numbers. In most cases the evidence is circumstantial.
As the narrative is uncertain, then so are the models developed by all three institutions especially as there is so little validation of the model in nature.
It has been suggested by the Expert Group that the data collected by trawling and sentinel cages is of low uncertainty as it is considered representative of the wild fish population. However, the analyses documented here show that there is a high level of inconsistency in the way the collection and the amount of resulting data.
In their report, the Expert Group cites an example detailed in an appendix to their 2019 report which discussed whether the threshold limits proposed by Taranger et al (2012) should be reviewed in light of new experimental data. In one experiment, zero growth was observed at 0.5/lice/gram of fish however they concluded their was no basis to change the limit and the Expert Group states that their view remains unchanged in 2023. They did not explain their decision.
However, the document about an assessment of the mortality limits used which is an appendix to the 2019 report states that ‘care must be taken in directly transferring observatons from tank experiments to wild salmon’. Yet, whilst this refers to the two experiments under consideration, it equally applies to every one of the tank experiments undertaken in the development of the narrative about sea lice. The document includes a list of references of relevant scientifc papers. One which is widely cited is by Wells et al. (2006)[36].
The title of this paper is ‘The physiological effects of simultaneous abrupt sea water entry and sea lice infestation on brown trout’. The paper is remembered for the conclusions about sea lice and not for the fact that the fish were also exposed to an abrupt entry to sea water which undounbtedly stressed the fish and made them highly suseptible to the introduced secondary sea lice infestation.
The wider science of parasitology includes warnings of reliance on experimental studies that do not reflect the very different nature of parasite infestations.
The 2019 appendix also includes the folowing text:
A number of considerations were also made of the distribution of salmon lice under given conditions. Often one sees that in the area with low infection pressure has many fish lice (high prevalence), but they have few lice each (low intensity). Salmon lice, like other parasites, are not a normal part of the population. This means that although most individuals have few or no lice, some individuals may have many lice. The results from the control locations without farming activity in national salmon lice monitoring in 2010 and 2011, however, showed that none of the sea trout had > 0.1 lice per gram of fish weight.
Firstly, it is clear that the Expert Group had awareness of the aggregated distribution of sea lice but did not consider this of sufficient relevance to mention it other than in an appendix written by at least two of the current Expert Group. It appears that the authors dismissed the relevance of this distribution because fish in the control group in 2010 and 2011 all carried low infestations. It could be suggested that this is a reflection of the poor sampling undertaken by those scientists working in this area, rather than the absence of some fish with higher lice counts.
However the most significant issue relating to uncertainties is that the fact that the Expert Group are all scientists who are also involved in the research about sea lice and who all have contributed to the existing narrative about the impacts of sea lice on wild fish. Inevitably, they are never going to question their own research and thus also the uncertainties of the wider narrative.
The members of the the Expert Group are named the following number of times in research papers listed in the reference section of the Expert Group report:
Leader – Knut W Vollset – 12
Deputy leader – Frank Nilsen – 5
Ingrid Ellingsen – 4
Ørjan Larlsen – 18
Rachel A Paterson -2
Lars Qviller- 6
Jofrid Skaròhamar – 10
Leif Christian Stige – 5
Ola Ugedal – 6
In addition, members of the Styringsgruppen are also references in the Expert Group report
Karin Kroon Boxaspen – 6
Tor F Næsje – 1
Eirik Biering 0
One of the papers in the reference section is Parasitic sea lice infestation on wild sea trout : Separating the roles of fish farms and temperatures. This is by Vollset, Qviller, Skår, Barlaup and Dohoo and was published in 2018 in Parasites & Vectors 11(1) 609.
The abstract of the paper states
“The causal relation between parasitic sea lice on fish farms and sea lice on wild fish is a controversial subject. A specific scientific debate has been whether the statistical association between infestation pressure (IP) from fish farms and the number of parasites observed on wild sea trout emerges purely because of a confounding and direct effect of temperature (T).”
The conclusion was:
“The estimates of the IP effect on louse counts along with the clear biennial pattern emerging due to the production cycle of fish farms clearly indicate that fish farms play an important role in the epidemiology of sea lice on wild sea trout. Furthermore, the mediation analysis demonstrates that a large proportion of the effect of T on louse counts is mediated through IP.”
It is likely that many scientists referencing this work will not take a deep dive into the data preferring to focus on the conclusions. However, examination of that data is illuminating. The paper covers data collected from 2009 to 2016 totalling 1,163 fish. These were caught be two different methods.
Traps – 794 fish and nets – 369 fish. On average, just 145 fish were examined a year. 31% of netted fish were lice free whilst just 10% of trapped fish carried no lice. Trapped fish tend not to be representative of the wider sea lice population.
Sampling occurred 266 times over the eight year period but 98 (37%) of these occasions caught just one fish. These can hardly be classed as representative of sea lice infestation rasing the question of whether examples of 100 single fish are the same as one sample of 100 fish.
The only conclusion of the sampling is that it is insufficient to allow the authors of this paper to arrive at any conclusive outcome of their original aims. Figures 32 and 33 show data from the Vollset et al (2018) paper.
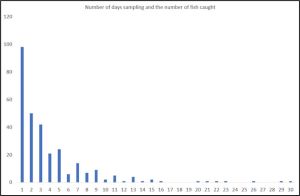
Figure 32: Number of samples of increasing fish catch (Vollset et al (2018).
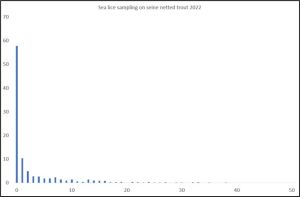
Figure 33. Percentage infestation of host fish with increasing numbers of sea lice (Vollset et al (2018).
Although this paper (Vollset et al. 2018) is listed in the reference section, there is no reference to it in the body of the report.
As K. W. Vollset is leader of the Expert Group, another paper listed in the reference section of the Expert Group report. This is Vollset et al. (2015) published in Fish & Fisheries 17 714-730. The title of this paper is Impacts of parasites on marine survival of Atlantic salmon : a meta – analysis . Why this paper is of interest is not its title or its content but the fact that one of eleven authors is named as Dr Martin Krkošek.
When he was a graduate student, Dr Krkošek authored a paper claiming sea lice from a specific salmon farm were killing wild salmon. However, the claimed mortality was actually modelled but he never tested the model by measuring the infestation in the locality. In fact, during part of the research, the farm was not even stocked with fish.
At the time, Dr Krkošek was working out of a field station set up by anti-salmon farming activist Alexandra Morton and since then Dr Krkošek has co-authored papers with Ms Morton. He is a long-term board member at the field station and remains committed to working against salmon farming. Any paper he is associated with, will not be favourable to salmon farming.
Model Land v Reality
Like many of the papers that investigate the impacts of sea lice on wild fish Vollset et al (2018) uses a model to determine how infestation pressure and temperature affect lice counts. However, whilst models do have a use, sea lice research, as well as the assessment for the Traffic Light production area classification appears to depend on the outcome of models rather than actually what happens in the thirteen production areas.
A recent book – Escape from Model Land[37] examines the risks that those working in a world determined by models are unable to tell the difference between Model Land and the real world. As with the Traffic Light System, there now appears to be an acceptance that the models actually reflect what is happening in the real world when in fact they don’t. The book states that it is all too easy to approach the models as sources of scientific fact when in fact they can be the source of much confusion.
The models used in the Traffic Light System predict the mortality of wild fish based on the ‘limited’ data collected. Table 15 in the Expert Group report indicates the PO 3 has been classified as red for every year since 2016 except 2019.
The Etne is an important salmon fishing river in Vestland and is located in PO 3. The Etne is also a sampling site used by IMR. Since 1993 salmon catches from the river Etne have been recorded by Statistics Norway and the annual totals are shown in figure 34.
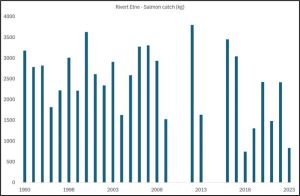
Figure 34. Salmon catch (kg ) from the river Etne from 1993 to 2023.
The river was closed for four year to help salmon population development but it is unclear why. Catches have fallen in recent years but whilst anglers will claim this is due to sea lice from salmon farms, there is no evidence to support this view. What is clear is that the number of salmon returning did improve after the second closure (Figure 35) (the data covering the first closure is not available.)
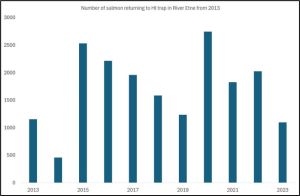
Figure 35 Numbers of salmon returning to the Etne trap from 2013.
Numbers of fish returning to the Etne improved after the closure. There is an added complication in the assessment in that the river Etne operated a stocking programme that ceased in 2019. The numbers of eggs and fry stocked varied from year to year but peaked in 2107. This might explain why the numbers of returning fish in 2000 were high.
As Norway has no areas that are totally free of salmon farms, an interesting comparison can be made with Scottish east coast rivers, as no salmon farms are located along that coast. Catches from the river Tay have shown significant declines over a similar period to the declines in the Etne (figure 36). Could it be that the reason for the declines are the same for both rivers?
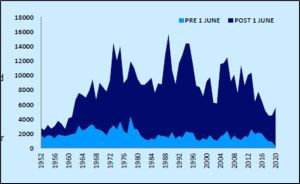
Figure 36 Catches of salmon from the river Tay in numbers of fish caught.
In the case of the river Etne, it s also worth considering that the majority of fish caught by anglers are killed for sport. In the most recent years, the percentage killed reached 96%.(Table 25).
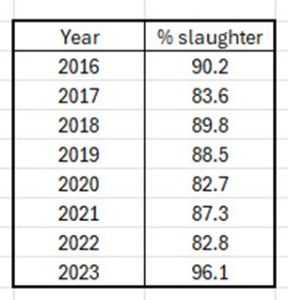
Table 25. Percentage of fish retained (slaughtered ) by anglers from the river Etne 2016-2023.
There appears to be no consideration of the actual catches of wild fish in the assessment of the Traffic Light System which instead relies on the output of the various models. If no actual assessment is made of the state of salmon stocks Norwegian rivers, then how can the success or failure of the Traffic Light System be truly assessed? If the focus on sea lice is failing to protect wild fish, then the Traffic Light System is not serving any purpose. The models must be validated to show that they reflect what is actually happening to wild salmon in Norwegian rivers.
Pre -2023
The 2024 Traffic Light classification included an assessment not just of the 2023 sea lice data but also of that for 2022, especially in relation to production areas PO 4 and PO 8. Table 26 shows the changes in sampling regimes between 2013 and 2022 but also of all the assessments from 2018 onwards from the NALO sea lice datasets.
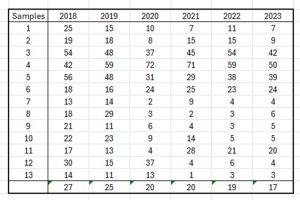
Table 26; Sampling occurrences from NALO sea lice datasets for TLS assessments from 2018 to 2023.
Table 27 shows the number of fish caught for each production area from 2018 onwards.
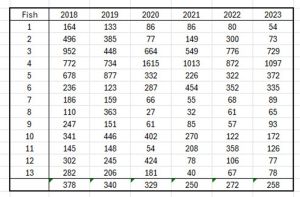
Table 27 Number of fish caught by NALO for the TLS assessment 2018 to 2023.
What is clear is that between 2018 and 2023 the average number of samplings fell from 27 in each production area to just 17. At the same time, the average number of fish sampled in each production area fell from 378 to 258.
Whilst the averages have changed, they do not reflect the position that the focus on sampling has moved away from those production areas considered to be a low risk to those that are considered a high risk. Thus in 2021, production area 13 was sampled in just one week catching only 40 fish. By comparison in 2020, PO 4 was sampled 72 times catching a total of 1615 fish.
It does seem that the scientists conducting the samplings have developed a preconceived idea of where the issues should be found and have specifically targeted them rather than conduct an ‘impartial’ assessment of all production areas every year.
It is clear that the same flaws that have beset the 2023 data apply equally to all the datasets used in the Traffic Light assessments
References
[1] https://brage.nina.no/nina-xmlui/bitstream/handle/11250/3104585/Produksjonsomr%c3%a5debasert%20vurdering%20av%20lakselusindusert%20villfiskd%c3%b8delighet%20i%202023.pdf?sequence=5&isAllowed=y
[2] https://www.vetinst.no/rapporter-og-publikasjoner/rapporter/2012/forslag-til-frstegenerasjons-mlemetode-for-miljeffekt-effektindikatorer-med-hensyn-til-genetisk-pvirkning-fra-oppdrettslaks-til-villaks-og-pvirkning-av-lakselus-fra-oppdrett-p-viltlevende-laksefiskbestander
[3] https://www.forskningsradet.no/siteassets/publikasjoner/2021/an-evaluation-of-the-scientific-basis-of-the-traffic-light-system-for-norwegian-salmonid-aquaculture.pdf
[4] https://www.dfo-mpo.gc.ca/csas-sccs/publications/resdocs-docrech/2014/2014_060-eng.html
[6] Helland, I. P., Uglem, I., Jansen, P. A., Diserud, O.H., Bjørn, P.A, & Finstad, B. 2015. Statistical and ecological challenges of monitoring parasitic salmon lice infestations in wild salmonid fish stocks. Aquacult Environ Interact 7. 267-280
[7] Robert Poulin (1998) Evolutionary Ecology of Parasites – From Individuals to communities 212 pp Champman Hall.
[8] https://en.wikipedia.org/wiki/Aggregated_distribution#:~:text=An%20aggregated%20distribution%2C%20commonly%20found,hosts%20are%20at%20high%20density.
[9] Crofton, H.D. (1971) A quantitative approach to parasitism, Parasitology 62. 179-193
[10] https://trafikklyssystemet.no/Publikasjoner/Styringsgruppens-r%C3%A5d-og-vurderinger
[11] https://www.barentswatch.no/
[12] Bush, A.O., Lafferty, K.D., Lotz, J.M. & Shostak, A.W. Parasitology meets ecology on its own terms: Margolis et al. Revisited. Journal of Parsitology 83. 575-583.
[13] https://www.hi.no/hi/nettrapporter/rapport-fra-havforskningen-2023-58#sec-5
[14] Rozsa L, Reiczigel, J. & Majoros G (2000) Quantifying parasites in samples of hosts. Journal of Parasitology 86. 228-232.
[15] Greig-Smith, P. (1983). Quantitative Plant Ecology 3rd Edition. University of California Preee. Berkeley. CA.
[16] See reference no 7.
[17] See reference no 4.
[18] Bjørn, P.A., Finstad, B., Asplin, L., Skilbrei, O., Nilsen, R., Serra-Llinares, R.M. & Boxaspen, K.K. (2011). Metodeutvikling for overvåkning og telling av lakselus på viltlevende laksefisk. Rapport fra Havforskningen 8-2011, 58 s.
[19] https://www.marine.ie/site-area/areas-activity/aquaculture/sea-lice/life-cycle-salmon-louse
[20] https://www.hi.no/en/hi/temasider/species/sea-lice
[21] https://www.hi.no/en/hi/about-us/employees/karin-kroon-boxaspen
[22] Boxaspen K (1997) Geographical and temporal variation in abundance of salmon lice on salmon. ICES Journal of Marine Science 54 1144-1147.
[23] Costelloe, M, Costellow, J and Roche N. (1996) Planktonic dispersion of larval salmon lice associated with cultured salmon in Western Ireland J. Mar Biol Ass UK 76. 141-149
[24] Nelson, E., Robinson, S, Feindel, N., Sterling, A., Byrne, A. Pee Ang, K. (2017) Horizontal and vertical distribution of sea lice in and around salmon farms J. Fish Diseases. DOI: 10.1111/jfd.12692
[25] Halstein T and Bergsjo T (9176) The salmon lice as a cause of disease in farmed salmonids. Rivista Italiana di Piscicoltura e Ittiopatologia A11 3-4.
[26] https://en.wikipedia.org/wiki/Schistosomiasis
[27] Boxshall G (1974) The development stages of L. pectoralis. Journal of Natural History 8 681-700
[28] Boxshall G (1976). The host specificity of L pectoralis. J. Fish Biol 8. 255-264
[29] Mordue (Luntz) A and M Birkett (2009) A review of host finding behaviour in parasitic sea lice. J Fish Disease 32 3-13
[30] Costellow, M. Costelloe J, Coghlan N. O’Donohoe, G. O’Connor B. (1998) Distribution of larval stages of sea lice n three bays on the west coast of Ireland. ICES Journal of Marine Science 55 181-187
[31] Pert, C, Fryer, R., Cook, P. Kilburn, R, McBeath, S. McBeath A. Matejusove I, Urguhart, K, Weir, S, McCarthy U. Collins, C. Amundrud, T. Bricknell, I (2014) Using sentinel cages to estimate infestation pressure on salmonids from Sha lice in Loch Shieldaig, Scotland. Aquaculture Environment Interactions 5 49-59
[32] Anstensrud M. (1990) Mating strategies of two parasitic copepods on flounder: polygamy, sex specific age at maturity and sex ration. Journal of Experimental Marine Biology and Ecology 136 141-158
[33] Bruno D W. & J Stone (1990) The role of saithe as a host for sea lice Aquaculture 89 201-207
[34] Bron, J, Sommerville, C, Wooten R and Rae G. (1993) Influence of treatment with dichlorovos on the epidemiology of sea lice on Scottish salmon farms in Pathogens of wild and farmed fish: Sea lice, eds Boxshall G and Defaye D. Eillis Horwood.
[35] https://www.hi.no/hi/nettrapporter/rapport-fra-havforskningen-2023-57
[36] Wells, A, Grierson C,, MacKenzie, M , Russon I, Reinardy, H ., Middlemis C, Bjorn P, Finstad B, Webelaar Bonga S, Todd, C & Hazon N. 2006. The physiological effects of simultaneous abrupt seawater entry and sea lice infestation of wild sea run brown trout. Canadian Journal of Fisheries & Aquatic Sciences 63 2809-2821.
[37] Erica Thompsen Escape form Model Land (2022) Basic Books London