Norsk Lakseelver: I rarely look at social media as it is now nothing short of an outlet for hate and abuse. However, my attention was drawn by a posting from the Norwegian Salmon Rivers (Norske Lakseelver) as shown:
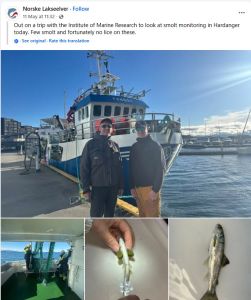
When did what is effectively an angler’s organisation become part of the scientific community and be part of a monitoring programme that aims to penalise the salmon farming industry, which Norske Lakseelver blames for the lack of wild salmon for them to catch and kill. This seems a very cosy relationship and brings into question the integrity of the scientific community. Are they following a predetermined agenda set by the angling community? This would help explain why neither Lakseelver nor the scientific community appear willing to discuss the major issues that have arisen from the science underpinning the Traffic Light System. Why are Norsk Lakseelver allowed to be part of the monitoring programme, even if they say that they are just observers. Surely representatives of the salmon farming industry have a much better claim to observe the monitoring of wild salmon as it is they that are blamed for their demise. I have commented previously about a representative of another organisation who showed on video how he regularly visited the IMR laboratory. It seems that if you represent the wild sector, then there is an open invitation to discuss the claims against salmon farmers but scientists like me are simply ignored.
This is simply unacceptable and IMR should explain why representatives from the angling sector were allowed on board a monitoring vessel as part of the sea lice monitoring programme.
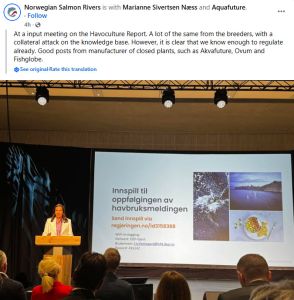
Interestingly, I heard about another comment from Norske Lakseelver following the recent meeting with the Minister. In this they say that the salmon industry repeats the same messages. Well, they should, until not just Ministers, but also those from the wild salmon sector are willing to listen and discuss the issues rather than simply blaming salmon farming for the lack of wild fish to catch.
Finally, there is a long rambling comment attached to this second posting which begins by saying that fish farming is humanity’s greatest and worst shame. The post then descends into the abuse and hate I mentioned at the start of this commentary. I guess it is indicative of the type of people that Norske Lakseelver attract to their social media account.
More modelling: The Institute of Marine Research (IMR) have just published a new report that looks at transmission of sea lice between farms with the view to target measures at those locations with strong routes of infection to effectively reduce infection pressure.
There may be a view that any farms that have persistently high lice counts over long periods of time, even years, should question themselves whether they are truly viable. However, IMR rely only on the results of a model to predict which farms they believe may cause issues.
As part of the model, IMR map where the infectious copepods are located hour by hour for any location. They illustrate this showing the modelled infectious dose as it heads towards a randomly selected location. This shows peaks of infection between August and November. What the report fails to mention is whether the model has been validated at all. Given the model predictions, it shouldn’t be beyond the realms of possibility that someone from IMR actually samples the predicted connectivity routes to identify these peaks of infectivity. Do they actually exist as the model predicts? What we know about sea lice would suggest that this model is just that and bears little resemblance to reality.
I recently wrote about my farm infraction index which was based on nine years of actual occurrences of high lice counts on farms in six fjord systems. I highlighted that there was no pattern to the infections and certainly no real evidence of connectivity.
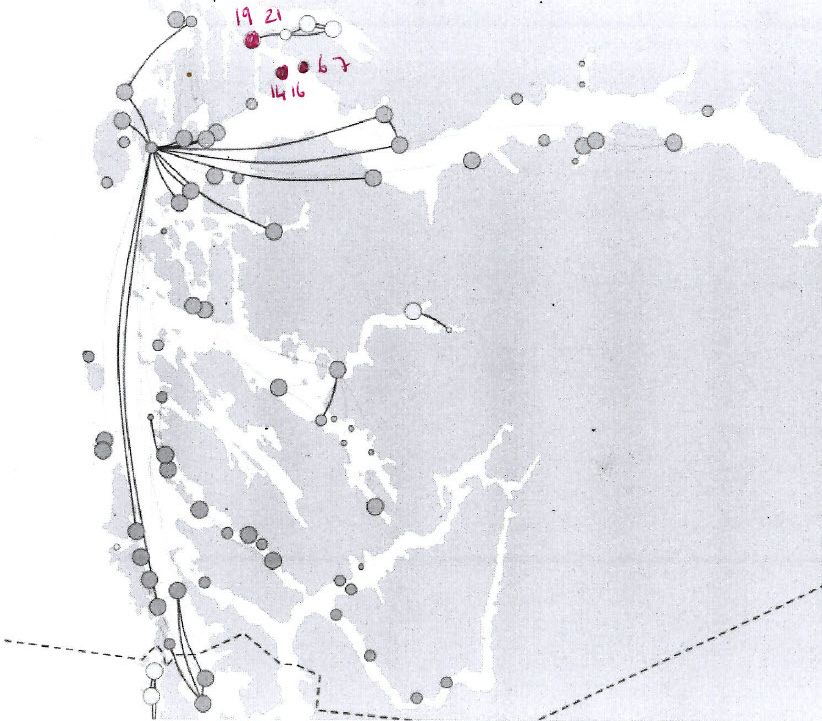
In their report IMR have plotted the connectivity between farms across all thirteen production areas. In this commentary I focus on Sognefjord primarily, as it is a long relatively straight fjord system in which connectivity should be readily apparent. IMR has predicted the connectively between farms for 2024 and 2025.
I have plotted the position of farms with high lice counts that exceed the limits set by Government regulation from week 1 up to week 21. This includes the sensitive period between weeks 16 and 21.
In 2024, four farms exceeded the lice limit, two before week 16 and two between week 16 and 21.
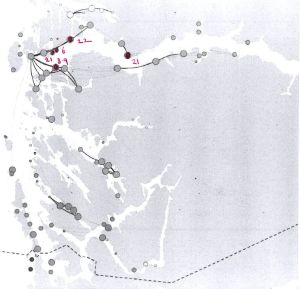
In 2025, the number was just three, one of which exceeded the limit before week 16 and two during the sensitive period.
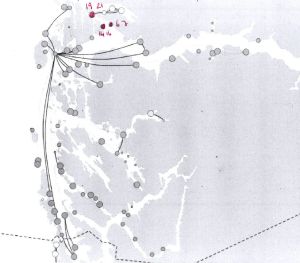
What is interesting is that none of these farms appear to follow the predicted routes of connectivity. The very few cases where lice levels were exceeded are close together but not on the predicted connectivity routes. It is possible that farms that are in proximity might be susceptible to cross infection but at the same time, they are also separated by significant numbers of weeks.
None of the predicted routes of connectivity show any similarity to what happened over the two years of 2024 and 2025. The only conclusion that can be drawn is that the model is wrong, as is much of the science that underpins the Traffic Light System. Sadly, much to the displeasure of Norsk Lakseelver, people like me need to continue questioning the output from the scientific community, until perhaps someone actually listens.
More CSA report: Paragraph 35 of the Chief Scientific Adviser (CSA) Marine’s report on the SEPA sea lice framework states that similar observation on the proximity of salmon farms and infestation levels on wild salmon has been collected from the west coast of Scotland. The report refers to two papers by Middlemas, (2010 and 2103), the second of which the key finding is that sea lice burdens on wild fish decrease with increasing distance from a farm.
The 2013 paper concluded the nearer a farm, then the higher the likelihood that wild sea trout could be infested above a critical level. However, sea trout could be negatively impacted up to 31 km from a farm although the authors say that there was considerable uncertainly around the cut off distance (with a 95% confidence between 13 and 149 km).
The authors have every right to be uncertain about the distance over which sea trout are impacted because their interpretation of the data should be questioned.
Scottish Government scientists and the local fishery trust have been sampling sea trout since 1997. The dataset includes the years from 2003 to 2009 which is the period covered in this study. The authors state that a total of 6,590 sea trout were sampled from 48 different sites. However, reference to the full Scottish Government dataset over this period lists 8,853 sea trout from 54 sites. This is 2,243 fish and six sites more than stated in the paper. The authors then select out fish which are below 198mm long, totalling 4,867 fish. In the full dataset, such fish total 5,584 or 717 fish more.
Whilst in theory it should be possible to work out which six sites are missing from the Middlemas paper, it is actually very difficult. This is because altogether the fish sampled from 31 of the sites totals 665 fish, which is still less than the 717 difference. The number of fish sampled at these sites ranges from 1 to 58 fish. Clearly not all years are sampled if the total number of fish sampled is just one. By comparison, the remaining 24 sites sampled between 59 and 639 fish. Just 18 sites sample over 100 fish during the seven-year period.
The authors have selected fish of 198mm long and less because this number relates to a paper by Alan Wells (now of Fisheries Management Scotland) from 2006. In this paper, it was calculated that 13 mobile lice could cause a fish harm. This is the threshold used by Middlemas. However, the Wells papers is also open to question because as the title of the paper suggests the impact was measured from the simultaneous abrupt sea water entry and sea lice infestation of wild sea trout. The meaning of abrupt is something sudden, unexpected and often unpleasant. This is not how the transfer of smolts from freshwater to sea water is likely to be described in nature, but this is the experience to which the fish in this study were exposed. It is not surprising that the fish were physiologically stressed and thus this suggested threshold is somewhat meaningless.
Middlemas developed a piecewise linear logistic model to estimate the relationship between farms and sea lice infestation. As an alternative, I have simply measured the percentage of fish with no lice and the percentage exposed to the Wells threshold. Whilst I wouldn’t use this number, Middlemas did so I have used it too. As many of the samples are small, I have selected those sites with larger sample sizes that meet the requirement for increased distance from a farm (km). The results are shown in the following table:
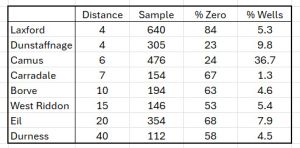
If the entry for Camus na Gaul is removed, the impact of lice appears not that much different regardless of the distance from where the fish were sampled to the nearest farm. What the study does not seem to consider is that the fish sampled may not have been resident in the same location since their arrival into seawater. It is not possible to say that a fish sampled 20km from a farm has never been much nearer that farm.
As the sampling took place over seven years, it is also not possible to say that lice counts are consistently high over the whole period. When the data for Camas na Gaul is broken down into separate years, the picture becomes clearer.
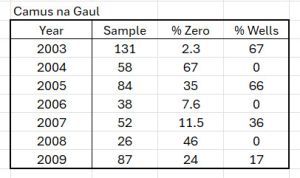
This data appears to show that lice counts are high in alternating years, which is the finding of the second Middlemas (2010) paper. As the CSA report highlights, sea lice counts on wild fish are associated with the stage of production on the farm. Middlemas found that counts on wild fish were higher during the second year of production on a farm. However, most of the data supplied in the paper comes from just two years. In addition, the longer-term data from Loch Shieldaig sampled very few fish.
The largest dataset is from Loch Laxford and used in the 2013 paper. The results are shown in the following table when this is divided into years.
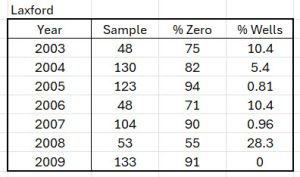
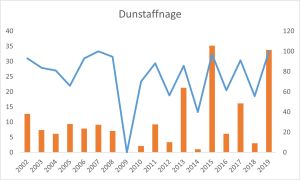
The division into a two-year cycle is not clear at all and in fact when more sites are examined over more years, the pattern is much less apparent at certain times as in this example from Dunstaffnage which is a site very close to a salmon farm.
Finally, it is worth mentioning that the sampling is carried out by a number of different fisheries trusts and when examining the data, there does seem to be some influence between lice counts and different trusts. Whilst there is a sampling protocol in place, we know that it is ignored at least in terms of number of fish sampled. In the twenty-three years to 2019, only 18% of the samples met the number set by the protocol. I have been made aware that those sampling lice at, at least one trust, are very adept at recording the spots on the fish as lice.
Paragraph 36 is an opinion from the CSA on the research which I have addressed in this and previous commentaries. He says that the evidence (my italics) demonstrates the scale of difference in baseline sea lice levels between the presence of salmon farm (west coast) and their absence (east coast) and that the presence of salmon farms influences the incidence of environmental sea lice.
That view is certainly one that be garnered from the headline findings of the scientific references used in the report however, when the data is examined further, these findings do not live up to expectation. The evidence that there is a difference in baseline sea lice levels between coasts that causes an impact on wild fish is extremely weak. In addition, the CSA has relied too heavily on a few papers produced by a small number of scientists.
One paper that has not been considered is MacKenzie 1998 and colleagues from the Marine Laboratory in Aberdeen. These researchers looked at the percentage prevalence of lice on wild fish but not just from the west coast sampling sites. They also sampled at the River South Esk and the River Eden on the east coast. Their simplified results can be seen in the following table.
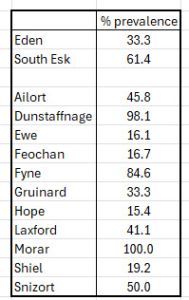
From these results, it does not seem that any perceived difference between the sea lice infestation of the two coasts is as clear cut as the CSA report suggests.