1+1=54: A recent report in Intrafish has reminded me of a question that I addressed some years ago but has now come to the fore.
According to NASCO, only 3% of migrating smolts currently return to their home river to breed. This is down from 20-25% in the 1980s. This 3% figure applies across the whole North Atlantic range of salmon. The exact figure is unclear, but some suggest that the return rate can be as low as 1-2%.
A 3% return means that 97% of salmon die at sea for reasons unknown. This is 97 out of every 100 smolts fail to return to their home river.
Turning to a different matter, the Norwegian Traffic Light System relies on calculated mortality to assess the risk to wild fish from sea lice.
The Green areas are estimated to have mortality levels of less than 10%.
The Yellow areas are estimated to have mortality levels of between 10 and 30%.
The Red areas are estimated to have mortality levels in excess of 30%.
If we try to connect the two, it means that wild fish emanating from rivers in a red area could have a mortality level of 97% plus 30% giving a total mortality of 127%, which is impossible.
Equally impossible would be that fish from green areas would suffer mortality where the 10% mortality due to sea lice is part of the 97% mortality giving a background mortality of 87%. In the case of yellow areas, the background mortality would be 77% and for red areas, just 67% mortality. It is just not possible that the background mortality is less when estimated mortality from sea lice is high.
So, are those estimating mortality making a mistake? The answer is not necessarily. The mortality levels calculate for the Traffic Light System may be correct or it may not be and that is something for discussion elsewhere. What is relevant here is that the 30% mortality level is not an absolute one so for every 100 smolts that migrate out of a river in a red area, 30 do not die from sea lice infestation. I recently discussed that the mortality in some rivers had been estimated at 60-70%. If 60-70 out of every 100 smolts died from sea lice, then the populations would have soon collapsed. We will have to wait to see how long such populations can suffer the current 97% mortality before they collapse. In Scotland, for example, 2025 was the worst year on record since 1952 for salmon catches, something we will probably start to hear every year from now on.
The 30% mortality estimated for red areas actually applies to the part of the migrating stock that actually returns equating to a total of 3 fish. So, in red areas, the mortality is 30% of 3 fish or 0.9 fish. Thus, in red areas, the number of fish returning would be 2.1 out of every hundred fish that migrated out of the area. In yellow areas it would be 2.4 fish (average 20% mortality) and in green areas, it would be 2.7 fish.
Thus, the difference between the three Traffic Light areas would be just 0.3 fish out of every 100 migrating smolts. This seems a lot of regulation for such a small number of fish and begs the question for the scientific community as to why they are so invested in something with such a small impact, when 97% of salmon die for reasons that remain unknown. It’s not surprising that the scientific community don’t want to discuss such questions.
Sea Lice Seminar: Intrafish published a lengthy report about the recent Sea Lice Seminar held in Bergen. There is much I could discuss but I was more interested in a comment that appeared at the end of the article. Intrafish interviewed a couple of members of the Sea Lice Expert Group including its leader Leif Christian Stige who has been a member of the Expert Group since 2020 and Knut Wiik Vollset who has been on the Group since it was established in 2016.
Dr Vollset told Intrafish that scientific discussion often takes place through posted comments where the arguments can become unnecessarily polarising. He added that there are often misunderstandings that can be easily cleared up but some are professional disagreements and seminars like the one in Bergen can help clarify what are misunderstandings and what are disagreements. He said that everything becomes more transparent at this type of seminar. I attended this seminar and the impression I gained was that it was actually as transparent as mud.
As regular readers will know I am all in favour of meetings, seminars or conferences where we can actually have a proper discussion about the science of sea lice. This seminar was not it. The theme of the seminar was ‘new’ science. They were not interested in discussing science already in the public domain. There were fourteen presentations, of which four challenged the existing science and each was followed by one or two of the those mentioned above explaining why this ‘new’ science wasn’t relevant. As the seminar took place in Norwegian, I can only repeat what was said to me in English after I gave one of the presentations, but more about that later.
Returning to the Intrafish article, it was said that one of the arguments is that we see a decline of wild salmon stocks in places where there is no salmon farming: an argument that the industry often uses. Intrafish says that this was most recently used by Mowi chief Ivan Vindheim at a meeting at the Barcelona Seafood Fair highlighting the similar decline on both east and west coasts of Scotland but where salmon farming take place only in the west.
Dr Vollset commented that there are many factors that affect wild salmon survival at sea and it is not just the influence of sea lice that plays a role.
It just happens that Dr Vollset is not just a member of the Sea Lice Expert Group, but he is also a member of Vitenskapelig råd for Lakseforvaltning (VRL) otherwise known as the Norwegian Scientific Advisory Committee for Atlantic Salmon and has been a member for about five years. Every year VRL publish a visual representation of the greatest threats to wild salmon and top of that list is sea lice and escapes from salmon farms. The possible risk from each threat has changed over the years with the most noticeable being climate change, which is now perceived to be one of the greatest threats to wild salmon alongside salmon farming. However, climate change is not the reason why in 2024 VRL described wild salmon stocks being at a historically low level. With climate change being a relatively recent threat, it is difficult to understand which other, of the many factors, has caused wild salmon numbers to plunge.
It is all too easy for scientists like Dr Vollset to dismiss clear evidence with a sweeping statement that there are many factors that affect wild salmon survival at sea but then only focus on sea lice. Scottish Government scientists made a similar sweeping dismissal of evidence in a report from 2016 when they said:
“It is very important to note that analyses of fishery catches such as these cannot be
used to prove whether or not fish farming has an impact on wild fish as there are
many other factors that may cause changes in fish populations and may differ
between the regions of coast that were considered. For example, catches of sea
trout have declined over recent decades on both farmed and non‐farmed areas in
Scotland and it is plausible that different factors are responsible in the two regions.”
It is now ten years since this was written and yet no plausible factor has been identified by these scientists as reasons for declines in a different area. It is all just in the minds of these scientists and not supported by any evidence. It has been suggested only as justification to maintain their focus on sea lice and salmon farming.
The number of wild salmon returning to their home rivers in both Scotland and Norway have been in decline for over fifty years yet there has been almost no attempt to find out why. This is because scientists have been too busy trying to attribute blame to sea lice and salmon farming.
Finally, it is worth pointing out that the scientific community both in Scotland and Norway have so far avoided explaining why the rate of decline of salmon catches is so similar from both Scottish coasts. It is clearly a question that is too difficult to answer.
My presentation: The Sea Lice Group demanded that any science presented at their recent seminar in Bergen must be new. They stressed that they were not interested in discussing issues arising from existing science. It had to be new.
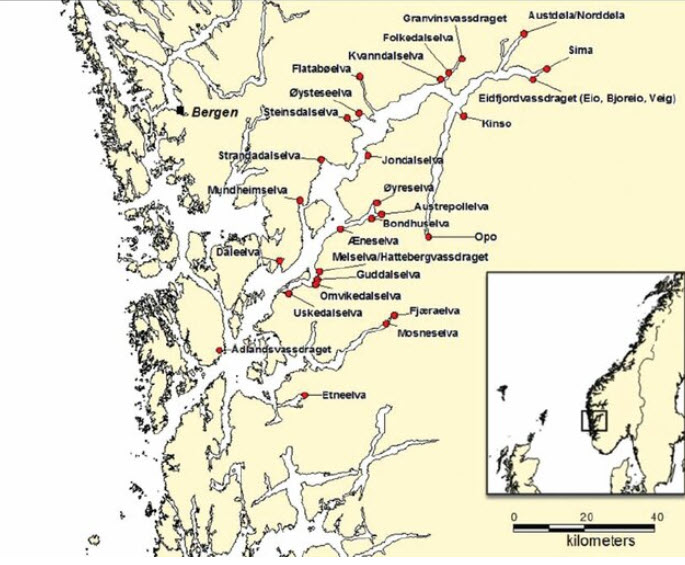
To adhere to this policy, I opted to investigate whether the actual lice pressure from salmon farms in six fjord system reflected the modelled infection pressure used to classify the production areas for the Traffic Light System. Two of the fjords were in red POs, two in yellow and two in green.
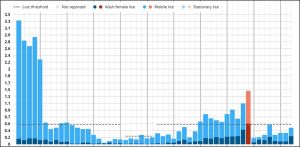
Salmon farms in Norway must observe strict sea lice limits throughout the year. In the south farmers must not exceed 0.5 adult female lice per fish except from week 16 to week 21 when the number must not exceed 0.2 adult females. This covers the period of the smolt migration. In the north because temperatures are colder the migration period is from week 21 to week 26.
Sea lice data is available from the Barentswatch website and is shown graphically for each farm. Whenever a farm exceeds the legislated limits, it is shown on the graph as red. At other times the graph shows lice counts in blue. It is assumed from the established narrative about sea lice that as long as the lice record remains blue, then farms are not contributing to a lice level that would impact on wild salmon. From this data, I have recorded each week that appears in red as one ‘infraction’.
In total, I looked at 372 farms over each of the nine years from 2017 that the Traffic Light System has been in place. That is 3,348 records. For each fjord, I summed up all the infractions for two periods. The first was from week 1 to week 22. This ensured that any lice in the fjord system would be assessed prior to the smolt migration window. The second period was the shorter smolt migration window of six weeks. The total number of infractions was then divided by the number of farms where lice had exceeded the limits to give what I have called the ‘Farm Infraction Index (FII)’. The table below shows the FII for the two periods for all six fjords systems as indicated by the PO they are located within.
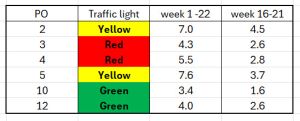
What is immediately apparent is that the lice pressure in the red POs is actually lower than that of the yellow POs. This is despite there being more farms in the red areas. What it shows is that the real lice pressure is very different from that modelled by the Expert Group and their colleagues. This suggests that the two red POs should be reclassified as yellow but of course nothing is that simple.
After my presentation, one of the members of the Expert Group stood up and explained that they might be aware that the actual lice pressure does not reflect that predicted by the modelling but that the fjords in the red areas are much longer than those elsewhere so the fish must swim through the lice infested waters for much longer and therefore are exposed to lice for longer too.
However, whilst some rivers are located at the end of the fjord, some 185 km from the sea, plenty of fish from other rivers have a much shorter journey. (Image from Merz 2013). The study of lice infested farms also shows that the farm infractions are quite random and thus the potential risk is unpredictable.
This focus on the length of the fjords would suggest that production areas with extremely long fjords such as PO3 and PO4 means that these production areas will always be considered high risk even if the real-life lice pressure is low. This is why if there is to be a review of the Traffic Light System it needs to take account of all science not just that which the Expert Group consider new.