NALO 2025: Following several requests, the Institute of Marine Research (IMR) have finally uploaded the data set for the 2025 NALO sea lice survey. This is the data from which the Traffic Light System classifications for each production area are derived.
PO3 and PO4 are usually the production areas that attract most interest, including my own but in this issue of reLAKSation, I will begin my analysis of the NALO data by focusing on PO 11. In their review of the data for the area between Kvaløya to Loppa, IMR say that they have surveyed a new site at Ytre Kvaløya near Tromsø for the first time, in addition to the site at Oksfjord in Nordreisa. Their findings are summed up in the following table:

The IMR report states that the sampling in week 27 indicates a high sea lice induced mortality at Ytre Kvaløya (33%) and low at Oksfjord (1%). They also say that week 27 was approximately two weeks after the midpoint of fish migration (week 25) but they considered this adequate as representative of the whole of the migration period. Finally, they say that Ytre Kvaløya is in an area of elevated density of sea lice whilst Oksfjord is in an area with low density.
From my perspective, when analysing sea lice infestation, I like to see consistency of sampling so that the data can be compared from year to year. When there are differences in the sampling, it becomes increasingly difficult to make any real assessment.
According to the above table, IMR sampled 42 fish in each of the two areas surveyed. In the case of Oksfjord, only ten sea trout were sampled with the remaining 32 fish being Arctic charr. I am not convinced that charr should be included in the survey at all because across all the production areas, IMR caught just 68 Arctic charr out of 2,603 fish. Arctic charr were only caught in POs 8 to 12 and only POs 10 and 11 had numbers greater than 7 fish. (13 and 32). Such small numbers of fish are not really representative of the fish population and whilst IMR also caught 15 salmon, 65 pinks and one other fish of unnamed species, these are not included in the analysis, so why are Arctic charr? Most of the production areas use data based on sea trout alone so this should apply to all production areas enabling, if possible, comparison of like with like.
As mentioned above, IMR sampled at a new location this year, Ytre Kvaløya and according to the table, they caught 42 fish. The report suggests that the fish were a mix of sea trout and Arctic charr, but the numbers were initially unknown because the data for Ytre Kvaløya was not included in the NALO dataset for 2025. The spreadsheet of the dataset lists Oksfjord as the only survey site in PO 11.
As I began the analysis of this data in the run up to Christmas, I was not hopeful of resolving the reason for the omission or obtaining the data until after the holidays however, I wrote to IMR anyway and was pleasantly surprised to receive a reply on the same day.
It seems that the data for Ytre Kvaløya is coded on the dataset as Tromsø, something I might have worked out for myself except Tromsø is confusingly listed as being in PO 10, not PO 11.
This is clearly an error, but as the final report was written by four members of IMR, I can only wonder how four different scientists have missed this glaring error. Perhaps some of them have given their name to the report without checking the accuracy of the raw data. Interestingly, the 2020 report was authored by six members of IMR together with two members from NORCE and a further two from NINA suggesting that the level of scrutiny is now not as great as it used to be.
The word ‘consistency’ or the lack of it keeps coming to mind with anything to do with the NALO data.
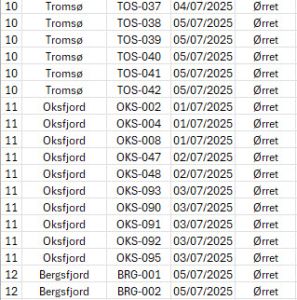
With access to the data from Ytre Kvaløya (Tromsø), I reached the same numbers as IMR for prevalence of 98% and an average lice count of infested fish of 31 with a maximum number of lice on one fish of 172. All 42 fish sampled were sea trout.
Unfortunately, I did not reach the same numbers as IMR for Oksfjord using counts from Arctic charr in addition to the sea trout. Of the 42 fish, 22 are lice free which gives a prevalence of 47.6% (IMR – 64%) and an intensity of 6 (IMR -5). However, we did agree on the maximum number of lice on one fish which was 47.
However, whilst IMR focus on prevalence and intensity. I like to consider the distribution of lice amongst the fish population. The site at Ytre Kvaløya (Tromsø) has a distribution as shown in the following graph.
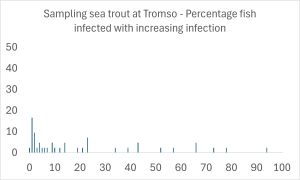
As can be seen, it is not representative of the accepted distribution of parasites which means that either the organism they were sampling was not a parasite or the sampling was poor and unrepresentative of the lice population on their hosts. Whilst the sample size was 42 fish which IMR say in their report was good and representative of the fish during the migration period. However, whilst 42 sea trout is clearly better than the catch of 10 sea trout at Oksfjord, the fish were caught over five days in numbers of 4, 15, 9, 9, and 5. On the second day one pink salmon was also caught but not included in the survey even though it carried 6 lice. Such small samples are never representative of a parasite population.
As indicated IMR suggest that the fish caught from Ytre Kvaløya were in an area of elevated density of sea lice whilst Oksfjord was considered to be an area of low sea lice density. IMR do not explain how they arrived at this assumption which I presume comes from their model to which I do not have access. Instead, I have chosen to look at the sea lice load on nearby farms at around the time of the sampling.
I have reviewed the lice loading on a total of 14 farms around the Ytre Kvaløya sampling site of which just three were operational. One of the others had a high lice count in week 16 but the fish were then harvested. A second farm, one of the three still operating, also had a lice count which just exceed the regulatory limit in week 21 after which lice levels were greatly reduced. Otherwise, lice levels have remained low.
There are a total of 19 farms surrounding the sampling site at Oksfjord of which ten were operational at the time of the sampling, one of which had a higher lice load, just in excess of the regulatory limit, in week 20. This would suggest that the lice levels around Oksfjord should be higher than those at Ytre Kvaløya in the run up to the sampling if the lice load follows the IMR narrative of sea lice dispersal. However, it seems there were few lice on any farm, and it is unclear how this relates to the idea of elevated sea lice density especially around the site at Ytre Kvaløya.
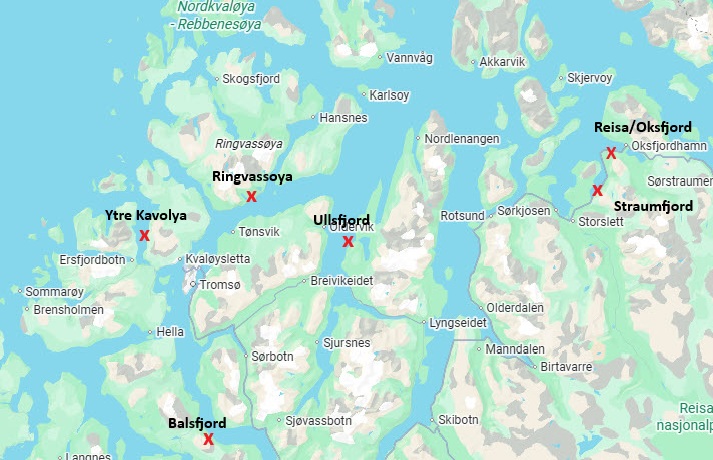
Ytre Kvaløya, or Tromsø as it has been named, is not the first new sampling station in PO11 as there have been others that have been used and abandoned, without explanation over the years. It has been interesting to chart the changes in PO 11 from 2018 to 2025 as they demonstrate the lack of consistency that pervades the Traffic Light assessment process and hence the impact on the salmon farming industry. The various sites sampled in PO11 are shown on the following map.

It is also interesting to compare the annual reports issued by IMR to see how much of the detail has been no longer included. For example, in 2018, 2019 and 2020, IMR discuss the total spawning stock of the local 17 rivers which was 8.5 tonnes with a theoretical production of 141,000 salmon smolts and contrast that with the 27 operational sites in PO11 at the time of sampling from which they estimate that in May 2018 around 300 million lice eggs would be released into the local fjords. In 2019, they say that there were 20 farms operating in PO11 with an estimated production of 700 million sea lice in May rising to 900 million by July. Lastly in 2020, the 36 farms were expecting to produce 5 million lice eggs per hour through until August.
By 2021, this information was omitted and instead they simply say that the model indicates a certain level of lice related mortality, which that year was moderate.
It is only when the sampling is compared, the lack of consistency becomes really apparent as illustrated in the following table.
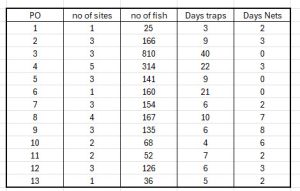
This shows for each of the thirteen production areas the number of sites sampled in a production area ranging from just one in three POs to five in PO 4. It also shows the number of sea trout caught in each PO ranged from just 25 in PO1 to 810 in PO3. Finally, the table shows the number days spent in each PO either catching fish in either traps or nets. In 2025, all the POs have sampled fish caught by traps whilst three POs have not used nets. The number of days fishing ranges from 5 to 40.
Whilst catches of large numbers of fish is to be welcomed, the problem is that these are total catches and many of the days record a low catch of fish, sometimes as low as just one fish. Repeated catches of low numbers of fish do not necessarily produce a representative sample. Lastly, the number of days which were fished but no fish were caught is not recorded.
Finally, I would like to draw attention to the variation in the number of sea trout caught at each of the 34 sites sampled by IMR in 2025.
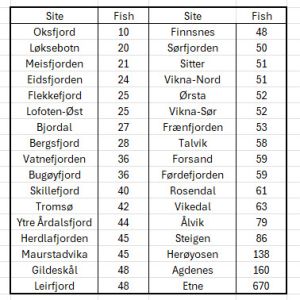
The number of fish caught ranges from10 to 670 with only three sites exceeding the 100 fish sample size recommended by Taranger in 2012. Even with the site at Etna producing 670 fish, the average catch for all 34 sites is just 69 fish, which is below Taranger’s recommendation.
As I have suggested, the inconsistency of sampling together with an over reliance on unvalidated modelling means that the Traffic Light System is just not fit for purpose. The fact that the dataset lists a sampling site in PO11 as being in PO10 demands much more scrutiny on the scientific community who make claims that simply do not reflect reality and this is not just about sea lice……
What a surprise: A new paper from researchers at IMR have discovered that when it comes to salmon genetics, natural selection will remove any genes that do not have any benefit to the future of salmon populations. Thus, if escaped farmed salmon do manage to interbreed with wild fish the genes of any resulting fish that are considered weaker or inferior, as the angling sector readily claim, will simply not survive.
The researchers, led by Kevin Glover of IMR, have said that ‘we know that the survival of wild salmon is negatively affected when they spawn together with escaped farmed fish, but we haven’t known what happens if the continuous impact slows down or stops.’
I can only wonder why it has taken so long for these researchers to reach the obvious conclusion that any negative impact, if there are any, will be bred out by natural selection as deduced by Charles Darwin many years ago. Any genes that remain tend to be markers with no genetic impact or will be considered neutral as this paper shows.
Kevin Glover told Intrafish that if a salmon river has more than 10 percent genetic mixing from escaped farm salmon it is considered to have a poor genetic condition adding that this new research shows something completely different. He now says that 10 percent genetic interference will produce little change in a single river population.
Intrafish states that Dr Glover has been working at IMR since 1997 and has devoted his professional life to salmon and genetics. I met him in 2016 at the ICES meeting on sea lice and escapes and like his Norwegian colleagues, he was not interested in any discussion on the possibility that escaped salmon would pose a problem for wild fish, especially as there were increasingly fewer reports of escapes.
Intrafish highlight that accepted thinking by the Scientific Committee on Salmon Management (VRL) has placed escapes as the second biggest risk to wild salmon stocks and that both IMR and NINA issue a report classifying the genetic status of rivers by a Traffic Light System on behalf of the Ministry of Climate and Environment as part of the Quality Standard for Wild Salmon. Currently over 30% of rivers are classified as having more than 10% genetic interference from farmed salmon and, hence having a poor genetic condition. However, Kevin Glover says that the new research shows that rivers of 10% genetic interference result in minimal change for wild salmon. He recognises that these new findings may be considered controversial, but I suggest that as Dr Glover led much of research implicating farmed salmon as a significant threat to wild salmon, those who question the validity of this research should see that those who are most committed to the established science now appear to accept they may have been wrong.
Interestingly, the new research is based on a model but the big difference between this model and that used against sea lice, is that the genetic model has been validated by empirical data.
Finally, Dr Glover says that this work does not excuse any escapes but clearly as escapes represent a loss to any farm, no farmer wants to see escapes either.
I hope that this work acts as a catalyst to encourage more discussion between the wild and farmed sectors, but I suspect that like all other work showing that salmon farming is not the issue it is made out to be, the wild sector will simply choose to ignore these latest findings.