Expert Group report: According to Fish Farming Expert, the Sea Lice Steering Group has submitted its’ 2025 report to the Norwegian government, and it is now published for public consumption. The main message is that one production area is red lighted, nine are given an amber warning and three are given the green light. This is the same as the previous assessments for 2024 and 2025. It does beg the question that if lice levels on farms are relatively stable, why do wild salmon numbers continue to plummet.
I am waiting for the raw data to be published before I analyse this latest report but, in the meantime, I would like to focus on the models produced by IMR. A couple of pages of the Expert Groups report is devoted to discussion of these models. The section begins that in order to be able to calculate where the sea lice larvae are located at any given time, IMR has developed a model system that calculates how sea lice are distributed in the water body by currents. An example of the plot is shown for PO4 around the Sognefjord.

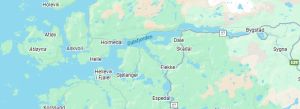
According to the report, the image shows the density of sea lice copepodites between the surface and 2 m depth during the smolt migration period in PO4 as calculated by the Institute of Marine Research model. The colour scale shows the number of lice per square meter, but that the values could be significantly higher than the colour scale in the yellow areas suggests. Areas without colour have no occurrence of copepodites or are outside PO4.
Whilst the image does not shed much light on the model excerpt for as a moment in time during the 18th May 2025, IMR have provided an example of the model in action. This can be viewed at: https://www.hi.no/hi/nyheter/2020/februar/slik-vet-vi-hvor-det-er-lakselus
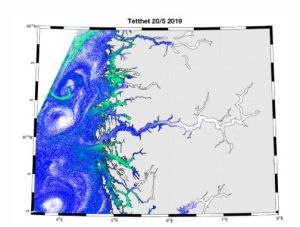
The animation of the model runs from 20th May to 6th June 2019 and during this time, the implication is that the lice concentrations in PO4 were high. At the start of the period in week 21, high sea lice concentrations are observed in three distinct areas.
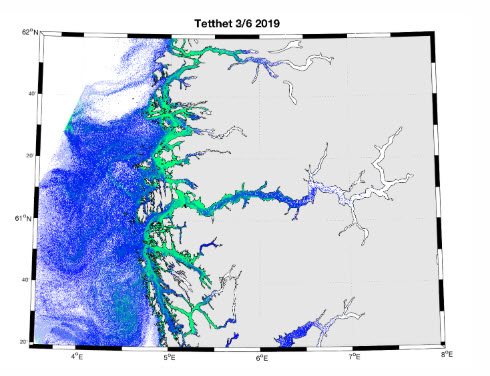
However, the accompanying caption states that the animation shows lice larvae being transported far inland into the Sognefjord during May/June 2019. The Sognefjord is the large fjord in the centre of the image which is coloured blue. As the animation progresses, a wave of green is shown moving up the fjord. This rather puzzling as the expectation is that lice larvae like migrating smolts will move down the fjord towards the sea as freshwater from the local rivers flows out to sea.
There is a known circulation of water in this long fjord with fresh and brackish water moving down the fjord but a submerged layer of sea water moving up the fjord. If lice do travel up the fjord, then they must stay in saline water to survive so might be expected to remain at depth. Of course, this is only conjecture, as the animation is just a model.
In 2019, the Expert Group concluded from all their information that the infection pressure in PO4 was moderate to high with high infection pressure at the mouths of most fjords through which most post smolts must pass.
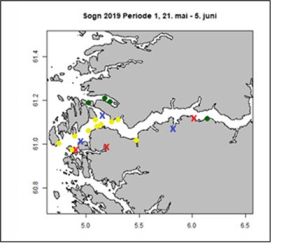
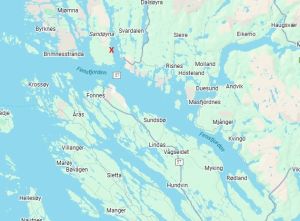
The Expert Group also refer to sentinel cages saying that the infection pressure is low to moderate in the first two weeks which is the period covered by the model. The sentinel cage data is shown in the following image

What is interesting is that out of 41 farming sites in Sognefjord, three had exceeded the lice limit in week 20 and for just one week only (Blue crosses). This is a week before the animation begins. Another three sites exceed the lice limit during the first week (Red crosses), again only for one week. These are shown in the following image.
What is more surprising is that if the lice concentration as implied in the animation, why more farms were not infected by high lice counts as the wave of infective larvae passed down or up the fjord. I would suggest that the reality of lice counts does not agree with the predictions made by the model.
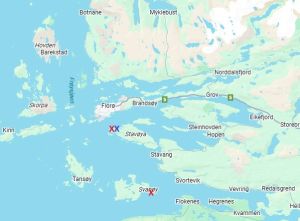
There are three other sites of high lice infestation sown on the 20th May 2019. The most northerly is around Færøysunde, an area which is home to twenty-three farms. One farm had lice counts that exceeded the limit in weeks 20 and 21 and a second has higher lice counts in week 21 only. Initially the wave of lice flows out to sea but then the whole coast is shown to have high lice concentration.
The second area is Dalsfjorden with eighteen farm and whilst the model shows a high lice concentration, lice levels on the farms are all below the regulatory lice limits.
The third area is south of Sognefjord and is Fensfjord. This fjord has nineteen farms of which only one exceeded the lice limit in week 21. In week 22 that farm reduced the infection to levels well below that required to meet the regulation.
By the end of the period covered by the animation, the lice levels predicted by the model are show in the image.

It would appear that whole coast is a soup of lice, yet the higher infections seen on farms are limited to so few sites that it is difficult to conceive where all these lice originated. . Out of the ten farms affected, six had lice levels just over the limit leaving four with levels higher than the limit but all were for just one week only. It is also a puzzle how lice infestation can be judged to be high when, so few farms have high lice counts and when in one area not even one farm exceeded the limits. Clearly something is very wrong, and I would suggest that is the model.
However, although we know the model is wrong, IMR, nor the Expert Group will face up to the truth. It is only necessary to look at the page when the model animation is displayed- https://www.hi.no/hi/nyheter/2020/februar/slik-vet-vi-hvor-det-er-lakselus, which is titled ‘How do we know where there are sea lice?’ This begins:
“Sea lice can drift for 50 kilometres with the current before they need to attach to a fish to survive and reproduce. By calculating where the water currents go, we can also calculate where sea lice drift and pose a threat to wild salmon and sea trout”.
The numbers and locations of the infective sea lice are simply the result of calculations, rather than the validation that is urgently needed to show where the lice can actually be found (if at all). As I have regularly pointed out, no-one has yet identified the sea lice in the water body except at very low concentrations. If the sea lice are not present in the fjords, then the model is rather meaningless because it isn’t a true picture of sea lice infestation. More importantly if the sea lice are not present, they do not represent a risk to wild salmon and seatrout
We must talk: Following a meeting held at Telegrafen in Oslo, the Institute of Marine Research posted a comment on Linked In which began:
‘We have to talk to each other AND work together’
I found this rather surprising since my experience of IMR is that they don’t want to talk at all unless it is about their own research. They certainly are not interested in discussing work that might contradict their findings.
I contacted the IMR press office asking whether the new policy of talking would extend to sea lice research. In reply they referred to a previous mail from one of their researchers that indicated that Sea Lice 2025 in Chile would be an ideal forum for discussion. It was then suggested that if I had a question, I could contact the individual concerned directly. This is like going round in circles as my experience is that any specific questions are rarely acknowledged, let alone answered, and if there is a response it usually evades the question.
This has led me to understand that IMR’s position is they are happy to talk and work together as long as it concerns issues they want to talk about, not those they don’t like talking about and especially those relating to sea lice.
I am still waiting for an answer to my question why no-one has yet found any numbers of infective sea lice larvae in Norwegian fjords as predicted by the IMR sea lice dispersal model.
HitLice again: Following the discussion of HitLice in reLAKSation no 1254, I was reminded of the last work package which is to be run by Nordlandsforskning (Norland Research Institute)
Work packages
WP1: Impacts of salmon lice on wild salmon in situ (NORCE)
WP2: Tolerance limits of wild salmon post-smolt to lice (HI)
WP3: External validation: Observed returns of salmon (NINA)
WP4: Reducing uncertainty about population-level effects of salmon lice (VI)
WP5: Perception and communication of the effects of salmon lice on wild fish (Nordlandsforskning)
The research summary states:
“Simultaneously the project will assess the causes of different stakeholder perceptions of the salmon lice challenge through surveys and by involving stakeholders (including scientists) in translating data to management advice in a post-normal science context.”
This is a real puzzle because it doesn’t matter what the article is about but any mention of farmed salmon in the press seems to include a reference to the damaging effects of sea lice on wild fish. In fact, just Googling the term ‘farmed salmon’ immediately raises the issue of sea lice.
However, I suspect that the inclusion of such research into the HitLice project has nothing to do with perceptions by the wider public but rather is intended to overcome challenges by the salmon farming industry and critically by those working on sea lice outside the established scientific community, What is interesting is the inclusion of the term post normal in the summary.
Post-normal science is described as a problem-solving strategy to be used when facts are uncertain, values in dispute, stakes are high and decisions urgent especially when relevant to policy decisions. This sounds an exact description of the sea lice issue but begs the question whether IMR consider the facts to be uncertain and the values are in dispute because if they were certain of the facts and confident in the values, surely, they don’t need to invest in perceptions and communications of the effect of sea lice on wild fish.
Sea lice data: I recently received notification that the Salmon Coast Field Station had published their latest report ‘Sea lice on juvenile wild salmon in the Broughton Archipelago in 2025’. This is the latest of their related annual reports, all of which are available on their website.
Although the report provides a link to the data, it has not yet been updated to include that for 2025. When it is available, I will discuss the results in a future issue of reLAKSation.
What interests me is that the Salmon Coast Field Station are happy to publish a report every year and to not only discuss their findings but also provide a link to the raw data. They say that they do this in the hope that the data will be used to further understand the factors influencing sea lice infestations on juvenile wild salmon for the betterment of wild salmon in the Broughton Archipelago and beyond.
I mention this Canadian report because I have been trying to obtain the Scottish data for sea lice counts on wild sea trout for 2025 without any success. As I have pointed out more than once, that whilst the wild fish sector demand that the salmon farming industry publish every dataset possible, when it comes to publishing their data, they seem extremely reticent to make it available.
Prior to 2020, the sea lice data wasn’t published at all until I requested it under FOI. A data set was then published, initially incorrectly, for data from 1997 to 2019. Data from then on has been published by Fisheries Management Scotland (FMS) on their website although unhelpfully as a pdf rather than as a plain spreadsheet. FMS control this data because it is FMS members who have been commissioned to undertake the monitoring work, although how impartial these members are is questionable.
This year I went to the FMS website to find that they have revamped the whole site to give it a new look, but in the process have removed all the pages devoted to the monitoring data. I therefore wrote to both the FMS general mailbox and to their salmon interactions manager to request the data. I would have hoped to have received a reply, but the reality is that FMS won’t respond to any mail from me because they consider me a threat, because I pose questions that they cannot answer. It is easier for them to make me out to be an out-of-control activist and thus justifying why they won’t answer my mails even if it just a request for data that should be published in the public domain.
Another example of their reluctance to share data is that FMS used to publish catch data in their Annual Review publication, but they stopped doing that after I questioned why their data did not match that published by the Scottish Government, especially as both sets come from the same sources. They obviously believe that if they don’t publish the data, then they can’t be asked inconvenient questions. Maybe this is why they have removed the sea lice data from their website too.
In the past, I have had to ask the Marine Directorate to supply spreadsheet versions of the sea lice data, but why they have this data is a puzzle because they always seem to ignore most of it. Their last analysis was of data from 2013 to 2017, that is eight years ago.
In reply to my request for data this year, dated 13th November, I was told that the Marine Directorate do not have this data and that the responsibility for it now lies with SEPA.
I thus wrote to the SEPA sea lice lead who simply passed my request to their FOI department This comes as no surprise since SEPA aren’t really interested in the data at all as their Sea Lice Risk Framework is totally reliant on their model and they aren’t interested in hearing any evidence that would bring their model into question. This is despite the fact that the evidence is mounting that shows their model is simply wrong.
I will be interested to see how soon SEPA provide this data. So far, they have dragged their feet on every issue I have raised so I suspect obtaining this data will be no different.
Sea lice monitoring is supposed to be part of the Sea Lice Risk Framework, but it seems a pointless exercise because no-one bothers to ever analyse the data. It is simply a reminder for those opposed to salmon farming to find a few fish with high lice infestations and then to say look what salmon farming does to wild fish.