Sentinels: It’s not news that SEPA, the regulator for sea lice in Scotland, has agreed to pay the Norwegian Institute of Marine Research (IMR) £200,000 for help and advice on the use of sentinel cages as a way of validating their sea lice dispersal model and assessing sea lice pressure.
It has always struck me as strange that SEPA should seek advice from IMR about sentinel cages and even stranger that they are willing to pay £200,000 for this advice, when their partners, the Marine Directorate have previously deployed sentinel cages in Scotland. There have been a number of papers written about using sentinel cages up in Loch Sheldaig around 2006-2008 but in 2011 -2013, Scottish scientists conducted a three-year deployment in Loch Linnhe. It was the results of this study that were used in the 2021 SPILLS project, as at the time they didn’t believe it necessary to repeat the work. I have also analysed the Scottish data and found that fish held in sentinel cages during the spring smolt migration over all three years, were subjected to really low lice levels. It was only in the autumn of 2013 that elevated lice levels were found in some, but not all, of the sentinel cages.
I am unclear as to what IMR can add to the existing approach to sentinel cages in Scotland and especially how such help can be valued at £200,000. IMR must have a good sales pitch.
By coincidence, I was looking at IMR’s data store for something else and noticed that the sentinel cage data for 2025 had been loaded. This provides me with a unique opportunity to delve into the data prior to the Sea Lice Expert Group reporting their findings. I also took the opportunity to put all the sentinel data together from the time of the Expert Group’s first report in 2016. This includes data from 2015. The sentinel cage data goes back as far as 2012, although the coverage is not comprehensive except for Hardangerfjord. Although IMR continue to deploy sentinel cages in Norway, the Expert Group now only give the results a cursory mention. However, whilst sentinel cages may not feature so significantly in the Expert Group’s predictions, SEPA in Scotland consider them sufficiently important to merit spending £200,000 for IMR’s advice.
Before I consider the latest data generated from the 2025 sentinel cage deployment, the analysis of all sentinel data for Hardanger from 2015 to 2025 has highlighted some generalised issues that are worthy of consideration first.
In total, there are eighteen sentinel cages deployed every year in the Hardanger fjord. The Expert Group state:
“Sentinel cages are approximately 1 m3 closed cages that hang from a depth of 0.5-1.5 m. 30 salmon smolts are placed in the cages and left outside for 14 days before the fish are removed and lice are counted”.
The first issue is the number of fish deployed. This is straightforward, 30 cultured smolts are placed in each deployment of each cage. Typically, there are two deployments a year and the data analysed here runs for eleven years. In total, this means that there are 468 cage deployments. Of these 468 cages, just 72 contained 30 fish when they were harvested. Thus, it might be expected that the remaining 85% contained fewer fish than 30 fish at the end. This would be a logical conclusion as the odd fish might have died. However, 70 of the harvest cages contained more than 30 fish. Perhaps an extra fish was added at the start by mistake but over the years, 70 cages are a lot of mistakes. In fact, in one case, the cage contained a total of 41 fish. This is a huge error, which is difficult to understand. How can 41 fish be counted in when the fixed number is 30 fish. As can be seen from the following table, a great deal of miscounting has taken place in these sentinel cage deployments.
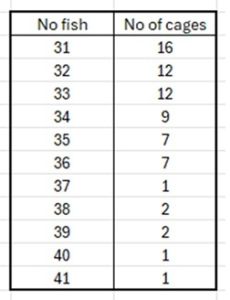
I struggle to understand how such errors can occur in the scientific world, which first and foremost should be about consistency. How can the impact of sea lice be assessed when there are different numbers of fish in each cage? In terms of cages with less than 30 fish, they range from 29 to zero, but it is impossible to determine if less than 30 fish were stocked at a lower number or whether the fish subsequently died. There are quite a number of cages from which no fish were harvested, but I am unable to determine why this was. I suspect the fish either died or escaped.
Although IMR post the data on their website. I would imagine that IMR scientists do not expect anyone to look at the data at all, let alone question its validity. They have previously written that they are the experts and others shouldn’t question their work. From what I have seen, there should be a lot of questions asked.
Interestingly, IMR must be aware of the discrepancies over numbers because in the recent Expert Group reports, the wording has been changed. The Expert Group explanation of sentinel cages now reads: “Approximately 30 salmon post-smolts are placed in the cages and left outside for 14 days before the fish are removed.”. I am sure even schoolkids can count exactly 30 fish into a cage given the opportunity to do so. I am also left wondering the about the statistical variation that is masked by the word approximately.
Yet, it is not just the number of fish in the cages where errors appear. The fish are left in the cages for 14 days prior to harvest. This year, there were two deployments and counting both the start and end date, the period covered by the first deployment ran to 17 days for some of the cages and 16 days for others. The length of the second deployment was 12 or 13 days depending on which cage.
As I said it is all about consistency.
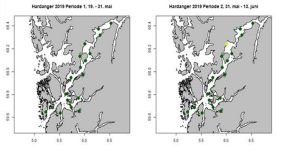
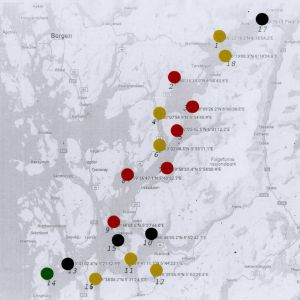
In their 2020 report, IMR posted the following images of sentinel cage infestation. (Green is low, Yellow – mid and Red – high infestation). However, the important point is that in 2020 IMR undertook three deployments.
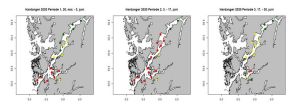
The only reason I can deduce why they increased the deployment was that in 2019, all the cages bar one showed low infestation, so they increased the period covered.
Interestingly, it was only in 2018, the number of deployments had been reduced from three to two and from what I can see, it seems that this was because many of the fish did not survive.
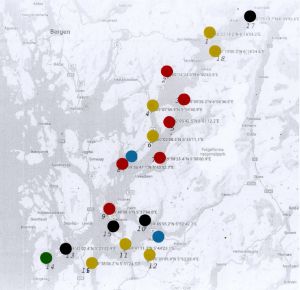
However, what interested me about the 2020 image was that it also appeared in the 2021 report but this time, I could see some differences in the first deployment. I reproduce both here.
Some of the cages with low infestation are now showing a mid-range infestation. For clarification, I have recalculated the data, and my results agree with those that were published in 2020.
My understanding of the sentinel cage deployments is that fish stocked are lice free as they have come from a freshwater hatchery. The idea is that the fish are exposed to the infective larval stages as they are dispersed by wind and currents away from salmon farms. In the 14 days that any larval lice manage to settle their development will be limited to early life stages such as the chalimus.
The total lice burden measured by IMR over the eleven years from 2015 to 2025 include the following:
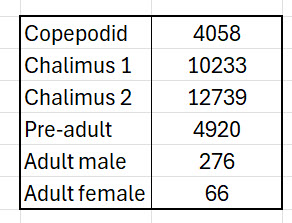
The short time the fish are held in the sentinel cage precludes the development of the later life stages so they must have arrived on the fish by some other means. There is no explanation from IMR or the Expert Group. Could it be possible that if these preadult and adults arrived in the sentinel cage by other means then perhaps the other life stages arrived by the same means and not as IMR claim by being carried by wind down the fjords until they encounter the fish in the sentinel cages. Close examination of the data makes it extremely difficult to draw their conclusions.
As I mentioned, the Expert Group’s or IMR ‘s analysis of the 2025 sentinel cage data has yet to be published so here is a first look.
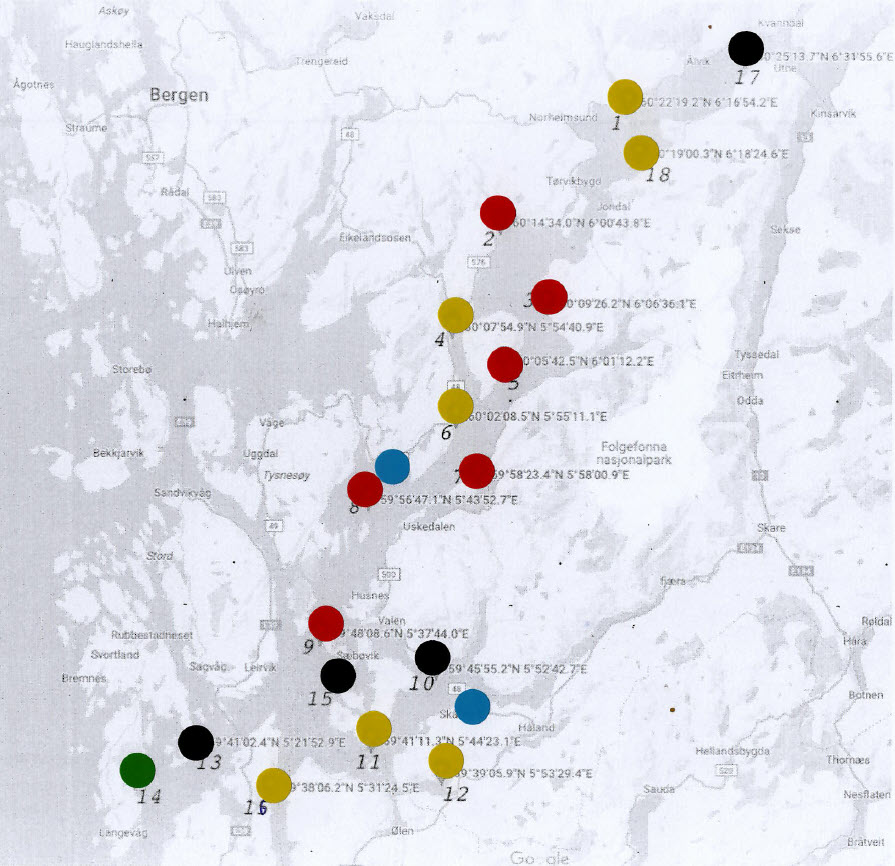
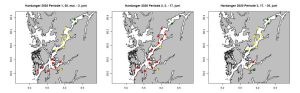
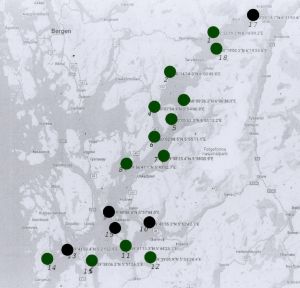
In 2025, there were two deployments of the sentinel cages in the Hardanger fjord. The first deployment ran from 27th May to 12th June or the 28th May to 12th June or the 28th May to 13th June. The assessment is judged by the average lice count on the surviving fish and expressed as Green under 2 lice per fish, Yellow 2-6 lice per fish and Red – more than 6 lice per fish. The final plot is shown below:
In addition to the three differently coloured plots, there are four plots shown in black. These are cages from which no fish were obtained. That means nearly a quarter of the potential data was not available. Looking at the distribution of the most infested cages (red), it might seem that a flow of lice moved from the east side of the fjord to the west then back again to the east. However, it is difficult to see from where the lice emanated.
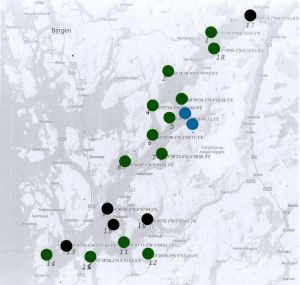
There are 83 salmon farms located in the Hardanger fjord and its environs, all of which have their weekly lice counts reported on the Barentswatch website. I have looked at every one of these farms and have determined that just two of the farms had lice counts above the legislated limit during this period. Their location (blue) is shown in relation to the sentinel cages in the following image.
The northernmost of the two farms is located close to one of the sentinel cages and the close proximity is one possible explanation for the higher lice counts and whilst there could be haloclines in the fjord carrying the lice north, the overall picture of infestation is not clear. The second farm, having similar lice counts, seems to have had a much lower impact on its surrounding sentinel cages. However, this all depends on whether the actual infestation reflects the established narrative of sea lice dispersal. Yet before any conclusion can be made, the second deployment should be considered. This ran from 12th June to 23rd June and 12th June to 24th June and 12th June to 26th June and 13th June to 25th June. The resulting plot is shown below:
During the second deployment, the number of cages giving no results rose to five or above a quarter. All the fish in the remaining cages were of low infestation. It does seem puzzling that six red and 7 yellow cages can in a matter of days change to all green. This low infestation could be explained because all the farms were then carrying low numbers of reproducing lice. Yet during this second deployment two farms exceeded their regulated limit on sea lice infestation.
Clearly, the presence of farms with higher than permitted lice levels does not necessarily imply that fish held in nearby sentinel cages will become infested.
It is also worth considering that sentinel cages are just one of the methods used by IMR to assess sea lice pressure. They also trawl the fjord for migrating wild salmon as well as sampling wild sea trout for lice using nets and traps. The data for sampling sea lice on sea trout has yet to be made available but IMR issued a progress report to the Norwegian Food Safety Authority on 7th July which was also posted on the IMR website. This states that the aim is provide robust data on sea lice infestation in wild salmonids for all 13 aquaculture production areas. The report concluded that the preliminary data indicates a high infestation pressure on migrating salmon in Hardangerfjord. However, data from sentinel cages is not used in the IMR preliminary report. Instead, their prediction of high infestation comes from a model.
Earlier in this commentary, I used the word consistency and when it comes to the data, there is a lack of consistency which complicates the analysis unnecessarily. For example, the Barentswatch website reports sea lice levels on farm using the recognised weekly numbering system. IMR have used the same system for recording lice counts from nets and traps and trawling but when it comes to sentinel cages, they begin and end during a week so instead of deploying the cages for 14 days during week 22 and 23, IMR have deployed the sentinel cages for most of week 22, all of week 23 and half of week 24. The second deployment ran from half or week 24, all of week 25 and one day of week 26.
The sea trout trapping and netting took place around Etne from week 21 to week 25 and in the other two locations in weeks 22 and 23. Yet, the trawling began on week 18 through to week 21, although just one fish was caught in the final week. IMR say that the trawling was brought forward by a week as there were signs of early migration. Yet even without early migration, the trawling would have started two weeks before the trapping and netting of sea trout began and three weeks before the sentinel cages were deployed. Surely the whole point of using different methods is to provide an overall view of what is happening at a particular time, not at three different times.
If the purpose is to assess and also protect wild salmon as they migrate out to sea, then it would make more sense to start the analysis before the fish migrate and continue it through the migration period and also afterwards in order to obtain a good understanding of the pressure on the migrating smolts, not the pressure after they have long gone.
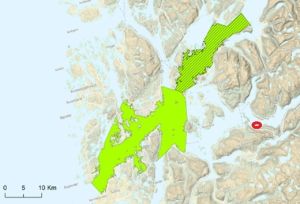
The IMR preliminary report from July includes discussion of the trawl data. As mentioned, trawling began a week early in week 18. Most of the trawling took place in the southwestern part of the fjord system with an additional 4 days spent towards the centre of the fjord. IMR published a map which I will refer to later.
I appreciate that IMR’s report is a preliminary one, but there are discrepancies between my analyses of the data and theirs. They report that a total of 225 post smolts were caught whereas I make the number 226.I appreciate that the difference is just one fish but that is the number that features in the dataset.
In week 18, they report that 136 fish were caught with an average lice count of 5. In week 19, 65 fish were caught with an average lice count of 26 and in week 20, a total of 23 fish had an average lice count of 5. My analysis has 66 fish caught in week 19 and the average lice counts for the three weeks as 3.11, 23 and 2.43. Whilst not significantly different, any discrepancy leads to questions about the accuracy and interpretation of all their data.
IMR say that this data from post-smolt trawling indicates a high infection pressure on migrating salmon from the Hardangerfjord system. However, this assertion is based on the 226 fish caught, but what is not clear is whether these fish are representative of the population or not.
Nevertheless, in arriving at their conclusion, IMR have not, to the best of my knowledge, taken into account the one other dataset that is highly relevant and that is the farm lice counts. I have tracked the sea lice counts on all 83 farms in Hardangerfjord from prior to the start of trawling and found that there is only one farm that was experiencing high lice counts and had been doing so from week 5 onwards. This farm is located in the western part of the fjord system, beyond Skånevik. The highest level was 1.1 adult female lice in week 8. The highest level during the sampling period was 0.68 in week 18.
There are two interesting points arising from the infestation level of this farm. The first is that if the farm was pumping out lice into the environment, then it might be expected that the first indication of a problem would be that the seven other farms downstream towards the main fjord system would become significantly infested too and they are not.
The second point is that the main area of trawling is about 25 km from the farm as the crow flies and probably approaching 30 km when navigating around the promontories etc. The IMR map shows the main area of trawling in green with the shaded green covered by just 4 trawls. It is very difficult to see how one farm in the western part of the fjord system could be responsible for elevated lice counts on salmon smolts in just one week, especially when the farm has been suffering elevated lice levels for three months and yet had no impact on any of the other farms in the vicinity.
As mentioned, the actual NALO sea trout data is not yet available, but the July report provides some information, especially for the area around the river Etne. Over five weeks a total of 612 fish were sampled of which 25% were lice free, although the IMR report fails to highlight this fact. Of the remaining fish, the smallest number of lice carried was one whilst one fish had 273 lice. The average number of lice per fish was 23 but this is misleading as parasite ecology tells us that the majority of fish will have very few lice and the majority will have many.
However, it is the location of sampling on the Etne system, which is interesting. The river Etne empties into Etnefjord which is where one of the sentinel cages is sited and where sampling for sea trout takes place. The nearest farm is around 8 kilometres away from the entrance to Etne fjord. If lice drift away from the farm, I suspect that they may be carried away from the Etne System, rather than towards it. At the same time, the entrance to the fjord is probably only about 400 metres across so restricting any potential inward flow.
A second farm, which is about 29 km away indirectly did suffer higher lice counts of 0.8 adult female lice in week 22 but it is difficult to see how lice from this farm would reach the sentinel cage in the Etne fjord. I wait for the net and trap sea trout data to be made available to make my own full assessment of the lice in the fjord.
It is very difficult to see from this data how IMR can conclude that the fish in the Hardangerfjord are exposed to a high infection pressure because despite the presence of so many farms, only a handful experienced elevated lice levels and only one could be considered a problem. The Hardangerfjord is 179 km long and covers an area of 8,471 km2 (according to aerialviews.org). Given that scientists have yet to identify any sea lice larvae in the water body, it seems incredible that one farm could elevate lice levels on both salmon and sea trout throughout this very large fjord system.
I don’t doubt that there are high lice levels on wild fish, but sadly scientists have become too reliant on models to evaluate what is happening to wild fish, that they have become fixated with the idea that high lice levels and declining wild fish stocks are inextricably linked, when the evidence suggests they are not. I would suggest that if there is a high lice infection pressure in Hardangerfjord, then it is not coming from the salmon farms.