Connections: The Norwegian Traffic Light System and the newly launched SEPA sea lice risk framework in Scotland are both designed to protect wild migrating fish from sea lice infestation but now according to Fish Farming Expert, there have been calls to scrap the Traffic Light System in Norway because it is not working. This is because a new comparison of the impacts published by PO3/PO4 Knowledge Incubator shows there is no correlation between sea lice counts on salmon farms and those on wild fish.
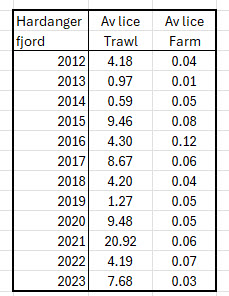
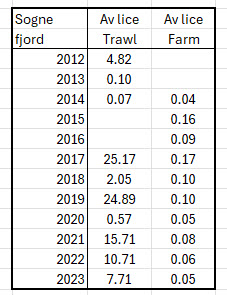
Their data goes back to 2012 and shows that lice levels on farms in the Hardangerfjord range from an average of 0.01 to 0.12 adult female lice whilst lice numbers of wild fish range from 0.59 to 20.92. In the Sognefjord, the figures range from 0.04 to 017 and 0.07 to 24.89 respectively.
I have included a summary of the two tables that appear in the Knowledge Incubator report as their complete tables delve more deeply into the figures by also looking at the tonnage of salmon in production. I don’t think it is necessary to go into that detail here as it is enough to ask the question as to where the evidence is that supports the need for any regulatory framework of salmon farms.
By coincidence, Scottish government scientists have just published a paper titled ‘Association of ectoparasite sea lice counts on farmed salmon and wild sea trout in Scotland.’ The final part of the abstract states:
“A significant positive association is identified between adult female sea lice abundance on farms and juvenile sea lice on wild trout. This association is consistent with a causal relationship in which increases in the number of sea lice copepods originating from lice colonising farmed salmon cause an increase of sea lice abundance on wild sea trout.”
The findings of this paper appear to contradict the latest data from Norway, and I suspect that those arguing the need for regulation would suggest that the Norwegian data has been published by salmon farming interests whilst the Scottish paper comes from government scientists. Thus, in their eyes, there is still a clear need for regulation.
Yet, the findings of the Scottish scientists are not all they seem. I would like to say that I have discussed the findings with them before writing about their paper, but they are extremely reluctant to discuss such findings with me.
The paper uses data which is familiar to me since I initially requested it be made available under FOI. It is the lice counts on wild fish collected from 1997. The original data set runs until 2019 and includes lice counts from 21,629 fish. Subsequent data from 2020 is published on the Fisheries Management Scotland website yet despite the availability of at least 25 years’ worth of data, the paper just considers the five years between 2013 to 2017. The authors explain this is because the form of reporting sea lice on farms changed in 2013 and again in 2018.I appreciate that the later data collection was impacted by Covid, but it seems that the longer data set still offered opportunities for analysis beyond those in this paper.
However, my concerns about this paper begin before any analysis is even considered. I have questions about some of the basic detail and I wonder that if the basic data is found to be questionable then can any of the analysis, results, or conclusions be trusted.
My concerns arise from the section on ‘Materials and Methods’ and more specifically part of the paragraph about ‘Lice on wild sea trout.’
The paragraph begins:
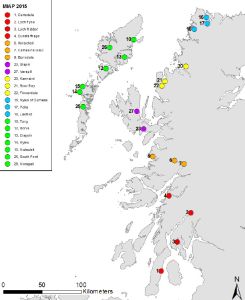
“The trout data comprise counts of L. salmonis on 5042 wild sea trout. Individual trout were sampled from 31 localities throughout the mainland west coast and Western Isles of Scotland during routine monitoring for the years 2013 to 2017 inclusive by 5 Fisheries Trusts (see Fig. 1).”
Figure 1 is a map of the west coast of Scotland divided into the regions covered by the 5 Fisheries Trusts. Each sampling site is marked by black triangles. Counting the triangles reveals a total of 30 sites not 31. These are distributed through the five fisheries trusts as follows:
Argyll 6
Lochaber 4
Skye & Wester Ross 9
West Sutherland 4
Outer Hebrides 7
At the same time, the dataset spread sheet lists a total of 5043 fish not 5042 as stated by the paper. The difference is because a 31st site – Dionard (1) – was sampled on 23rd May 2013 from which one fish was caught which was lice free. Dionard was not sampled again until 2nd June 2016 and at a different site Dionard (2). The paper should either say 31 sites and 5043 fish or 30 sites and 5042 fish and not as stated.
Returning to the original dataset spread sheet, each site is attributed to a region. According to the spreadsheet (and ignoring Dionard (1)) then the sites are located as follows:
Argyll 6
Lochaber 4
Skye & Wester Ross 8
West Sutherland 4
Outer Hebrides 6
‘NA’ 1
Lochalsh 1
Four localities in the spreadsheet are incorrectly attributed to an area. These are Borrodale, which is placed on the Isle of Skye but is in Lochaber. Kyles which is placed in Argyll but is in the Outer Hebrides, Loch Etive which is placed in Lochaber but is located in Argyll and Kanaird which is actually found in Wester Ross but was cited as ‘NA’. Given that Marine Scotland received the data from the five fisheries trusts, it is unclear why any are incorrectly located in the dataset. The locations are clearly set out in a series of reports published at the time by the Rivers & Trusts of Scotland.
The paper continues that:
Five of the localities were sampled once over the 5-year period, 14 annually, 2 missed a single year and the rest were sampled over 2 or 3 years.
Analysis of the dataset shows that the number of locations that were sampled between one year and five years was as follows:
1 year – 4 locations
2 years -6 locations
3 years -3 locations
4 years – 3 locations
5 years 14 locations
This means that the claim made in the paper that 2 locations missed a single year is incorrect as 3 locations were sampled over 4 years. It is also wrong to say that five locations were sampled just once as the actual number was 4.
The paper states that sampling occurred between 1 and 9 days at each locality each year.
Sampling over nine days was actually unusual with most sampling taking place over two or three days in the year and typically just one a month over the five-year period.
1 day – 10 times
2 days – 57 times
3 days – 29 times
4 days – 7 times
5 days – 2 times
6 days – 1 time
7 days – 0
8 days – 0
9 days – 1 time
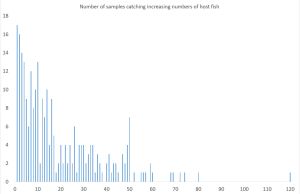
The paper also states that up to 120 trout were caught in a sample. However, the average sample contained just 19 fish. Only 7.5% of the samples caught 50 fish or more.
Finally, the paper states that the sampling was conducted using a standardised protocol, which was published by the Scottish Fisheries Coordination Centre (SFCC) in 2009. According to the Fisheries Management Scotland (FMS) website, the SFCC was established in 1997 and is focussed on evidence-based fisheries management. The membership comprises of Rivers and Fisheries Trusts, District Salmon Fishery Boards, Scottish Government, Scottish Environmental Protection Agency, and Nature Scot. In 2017 SFCC became part of Fisheries Management Scotland.
The protocol states that the aim should be to catch a minimum of 30 fish.
It also states that “to gain the greatest possible value resulting from a standardised sampling protocol, the sampling should be carried out on three days in May and June. It also indicates that the sample of 30 fish can be collected over these three days in May and June.”
I have analysed data over many years and in my opinion, the size of the sample is important in the determination of sea lice infestation. This is because sea lice are not distributed normally but as an aggregated distribution. Although Taranger (2012) recommends a minimum of 100 fish, his recommendation is largely ignored, especially in Norway. I refer to Norway because Taranger is part of the same scientific community who sample for sea lice so they should be more acutely aware of his recommendations.
I have tried in the past to determine how SFFC arrived at a minimum sample size of 30 and my request for clarification received the following answer:
“A target sample size of 30 trout is a rule of thumb that gives a sensible sample size for quantifying variation in lice infestation among fish at an individual site within a discrete sampling period. Failure to achieve this sample size on some occasions (which may occur for many reasons, not least the availability of fish) does not prevent subsequent analyses of spatial and temporal variation in infestation levels among sites and years.”
In fact, I suspect that the sample size of 30 comes from the Central Limit Theorem rather than a rule of thumb. One description of the CLT suggests that a sample size of 30 is fairly common across statistics as a sample size of 30 often increases the confidence interval of the population dataset enough to warrant assertions against the findings. The higher the sample size, the more likely the sample will be representative of the population set. However, CLT relates to normalised distribution, and I am not convinced that the same view relates to other distributions such as an aggregated one.
Analysis of the sampling data indicates that out of the 264 sampling days, 75.8% do not meet the minimum sample size set by the protocol. It could be argued by the SFCC, that the protocol does not suggest that the sample of 30 fish should be collected in one netting but could be collected over the three days of sampling instead. However, analysis of the catch data shows that 70% of the annual catches do not meet the protocol either.
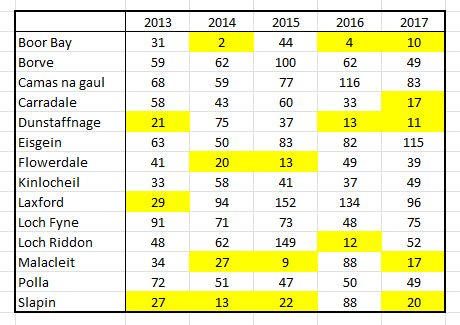
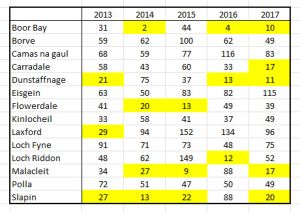
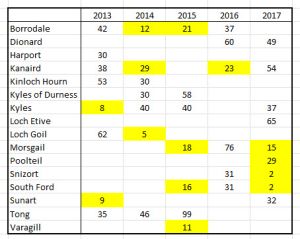
Finally, the protocol is clear that the sampling should be conducted over three days in May and June and when this is considered then 80% of the annual samplings do not meet the protocol’s requirements. The first of the following two tables is of the 14 sites that were sampled over all 5 years. The yellow highlights years in which 30 sized samples were not achieved. The second table is of sites sampled for between one and four years.
Whichever requirement is considered, then the reality is that between 70% and 80% of the samplings do not meet the protocol and thus the majority of the data used in this paper must be viewed as being invalid.
It should be remembered that Marine Scotland have said that failure to achieve this sample size on some occasions (which may occur for many reasons, not least the availability of fish) does not prevent subsequent analyses of spatial and temporal variation in infestation levels among sites and years.” I would disagree. The protocol was established for a reason and that reason cannot be ignored simply because it doesn’t fit in with those promoting a specific narrative. The science must be accurate and in the case of sea lice monitoring it is not.
There are two points that arise from this work that require further discussion. The sea lice data routinely collected for this study is intended to support the established sea lice narrative. The narrative blames sea lice from salmon farms for a negative impact on wild fish. It is not enough to hold up a few examples of wild fish infested with numerous lice to say that this is all the evidence that is needed. This is jobs and people’s livelihoods that are being put at risk dependent on this data and therefore the data must be accurate. Marine Scotland acknowledge that it can be difficult to collect sufficient samples at any one time, but their difficulty in doing so must not result in the salmon farming sector being penalised regardless. Instead, SFCC and the whole of the wild fish sector need to work out a way to obtain better samples to support their narrative because clearly, the current approach is not working.
The second point is that the new paper does not appear to analyse all of the 5042 fish at one time. When lice counts on every fish are expressed as a percentage of increasing lice infestation, the resulting graph can be seen below:
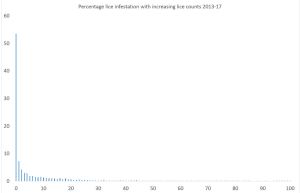
In the discussion, the paper states that the data they present is consistent with laboratory studies that sea trout suffer severe physiological impacts when levels of mobile lice exceed 13 lice per fish for a fish of 37g. Unfortunately, the sea lice infestation data for 2013 to 2017 does not include fish weights so it is impossible to conduct a similar assessment. Instead, the distribution shows that just over 16% of the sampled fish carry 13 lice or more of any stage. This means that 84% of the sampled fish cannot be adjudged to be at risk. Over 50% of the host fish are totally lice free and certainly cannot be at any risk at all.
No doubt, those promoting the closure of salmon farms will use this paper as further proof of why farms should be removed. What it does show is that the debate over the impacts of sea lice is far from over. It also shows that the connection between salmon farms and wild fish is mostly in people’s minds, not in the science.
Protocol: Since writing the above commentary, Fisheries Management Scotland has published their 2024 Annual Review. This includes a section on managing interactions with aquaculture. Some of this was written by the departing Aquaculture Interactions Manager whilst the rest was written by an unnamed person who presumably has a senior position in the organisation.
The relevant paragraph describes that in preparation for the process of ongoing monitoring of sea lice on wild fish for the SEPA sea lice framework, the Scottish Fisheries’ Coordination Centre which is now part of Fisheries Management Scotland is revising the sea lice sampling protocol which they hope will be soon completed.
This is clearly in recognition that the current format of the protocol is not fit for purpose as illustrated by the fact that up to 80% of the samples used in the Scottish Government’s scientific paper that analysed the data from 2013-2017 did not meet the requirements of the existing protocol.
The revelation that the protocol is being revised comes as a surprise. There has been no public announcement of the revisions and no requests to help ensure that the protocol is fit for purpose.
Certainly the current sample size of 30 fish is far too small. Taranger et al (2012) recommends a sample size of at least 100 fish and in my opinion the 100 fish should be collected in one go or in two or three nettings of large numbers of fish. Samples of less than 10 fish should be discarded as unrepresentative. Sadly, the new protocol will undoubtedly reflect the views of the angling fraternity rather than science and especially of parasite ecology. Unfortunately, as the protocol is being written by the wild fish sector, that is to be expected.