
Framed-work: Fish Farming Expert has reports that SEPA has published its response to its second consultation. This has elicited a strong reaction from the salmon farming sector. Salmon Scotland say that the plans place undue reliance on a proposed modelling framework that it will not be possible to validate. It cannot be possible to regulate a sector when the effectiveness of the regulation cannot be determined. They say that they support regulation based on fact, evidence, and sound science.
Following publication of the consultation responses, the Scottish Environmental Protection Agency (SEPA) posted a one minute 15 second video on X. This can be viewed at: https://twitter.com/i/status/1732769779667062844
The video features Martin Marsden head of Environmental Quality who says that he has been leading development of the regulatory framework for controlling sea lice. He says that ‘we have spoken to industry, fishery interests, local communities, other regulators and we now have a new framework to control the release of sea lice’. He continues by saying that ‘this framework is based on the best available science and following international best practice.’
Whilst SEPA may have spoken to a wide range of interested parties, they have failed to listen to what was said. This is clear from the statement that the framework is based on the best available science. I would argue that the framework is not based on much science at all, let alone best available. During the various consultations and workshops, the one thing SEPA made absolutely clear was that it was not their role to discuss the science and thus they have no idea at all whether the ‘science’ that is incorporated in their model is best available or not. As regular readers of reLAKSation will be aware, those involved in sea lice research refuse to discuss the science, as did SIWG, whose unscientific decisions led Ministers to recommend this framework.
I am not a modeller, but I am aware of two fundamental scientific flaws in the sea lice dispersal models, irrespective of whether it’s SEPA’s model, or the Norwegian one or any other. The problem with the science is a total unwillingness by those involved to want to discuss it.
The X feed links to the official SEPA media release which, when discussing best international practice refers to the science, not as best available but rather as cutting edge. I shall be submitting a FOI to SEPA to request details of this cutting-edge science that they plan to use to triage the risk to wild fish. As far as I am aware the only ‘science’ being used to assess risk now is over ten years old, has yet to be validated and is determined using extremely unreliable data.
Salmon Scotland have said they support regulation based on sound science, which this is not, evidence of which there is none and fact. The only fact that is known is that this framework exists solely to appease a bunch of whingeing anglers who for many years have blamed salmon farming for the decline of wild salmon and sea trout, simply because it deflects attention away from their own complicity in the decline of wild fish populations.
There is one other fact that is worth repeating is that which is on record and that is Peter Pollard, Head of Ecology at SEPA said to the Scottish Parliamentary REC Committee in November 2020 that “Do we think that sea lice from farmed fish are responsible for the declines that we have seen over decades in wild fish. He then answered his own question ‘No’.
I shall discuss the consultation further in the next mailing.
Sampling: This week, I gave a presentation at the MASTS (Marine Alliance for Science and Technology for Scotland) conference in Glasgow. The title was ‘A reassessment of the impacts of sea lice on wild salmonid fish’. This was extremely timely given the proposed SEPA sea lice framework as well as the proposed 2024 gradings for the Norwegian Traffic Light System. The reality is that both systems of regulation are based on an extremely flawed premise and that is that sea lice from salmon farms are having a negative impact on wild fish stocks.
The data on which these assumptions are made leaves a lot to be desired. At least Fisheries Management Scotland have published their sea lice sampling data for 2023 whilst the Institute of Marine Research in Norway are unwilling to share theirs.
However, my presentation focussed on data collected by the west coast fisheries trusts from 2015 to 2019. Although the time allowed did not allow me to present extended analysis, the time span was selected from data going back to 1997 because prior to 2015, the weights of the fish was not recorded and after 2019, COVID restrictions meant only a limited number of locations were sampled. In all, 5,178 fish were sampled over the five years.
These fish were sampled a total of 293 times across 31 different locations by the five fishery trusts. These trusts provide very little information of their individual sampling except Wester Ross Fishery Trust which does from time to time publish the results from some of their samplings. I illustrated my presentation with an image of one of their results sheets. The trust applied the Taranger formula that estimates mortality to these sampled fish but of more interest to me was the distribution of lice infestation across the sample, which actually showed no discernible pattern.
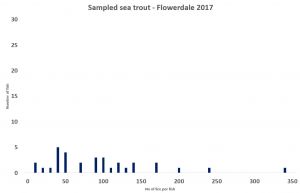
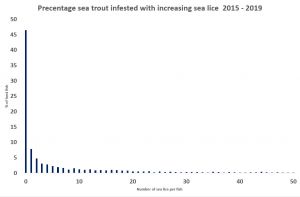
However, when the lice infestation of the 5,178 fish is plotted, the lice infestation becomes much clearer as an aggregated distribution, which is now known to be the defining feature of all parasites including sea lice. The distribution shows that just under 50% of the fish in this sample are lice free with many more carrying very low levels of lice. If such a high number of fish are carrying no or very low levels of lice, they cannot be at risk of mortality as the angling sector claim.
Of course, a different sample might give a different percentage of lice free fish. It really depends on the sample size. Although Wester Ross fishery trust sampled 32 fish on 27th April 2017, it is not clear whether these fish were caught in one netting or in several nettings over the same day. Clearly, it makes a difference as several smaller samples are not the same as one larger one. This is because it is more likely that weaker fish might be caught whereas strong healthy ones are likely to escape the net. This means that the sampling is more likely to occur from fish at the higher end of the horizontal axis.
There is a protocol for the west coast sampling programme. This states that the sample size should be 30 fish, yet of the 293 samplings only 71 (24%) achieve this number with half the samplings catching between 1 and 10 fish and 50 catching just one fish. How the number of 30 was chosen for the protocol is unclear. When the question was asked, the answer was that 30 is a rule of thumb number that gives a sensible size for sampling, however failure to achieve this number does not prevent subsequent analysis of lice infestation both of sites and years. Whilst low numbers are supposed not to prevent analysis of the data, since this data was first collected in 1997, there has not been a single paper published using all the sea lice data collected from across Scotland.
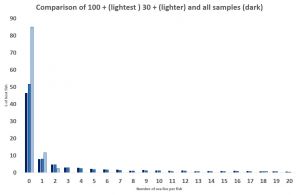
If the sea lice distribution from all the fish sampled between 2015 and 2019 is compared with that of the fish collected by samplings over 30 fish in size, the percentage of lice free fish increases to over 50%. It’s not a great difference but as discussed it is unknown whether these samples are of 30 fish or are made up of several smaller samples. Such information should be recorded but is not on the published sheets.
Whilst the Scottish sampling protocol recommends a sample size of 30 fish, Taranger (2012) recommends a minimum of 100 fish, as well as saying that these should be caught once the fish are well out in the fjords rather than around the shoreline, which of course is where the Scottish sampling occurs.
The Norwegian sampling recommendations are relevant because these form part of the Taranger formula that is now used widely in Scotland to estimate mortality.
Between 2015 and 2019, only one sampling in Scotland caught more than 100 fish. As this was a large number, it must be assumed that they were caught at the same time and not as the result of multiple nettings. If the lice distribution on these 120 fish is compared to the thirty plus sample and that of the total fish number, it can be seen that the percentage of lice free fish increases to about 85%. That is 85% of the sampled fish are lice free. This may not be the case with every large sample of fish, but it does provide an indication that large samples of fish provide a better indication of the lice infestation of wild fish.
Unfortunately, whilst the wild fish sector continues to demand more stringent controls on sea lice, the reality is that a better and more reliable assessment of sea lice infestation is much more urgently required.
As it happens Fisheries Management Scotland has been trialling the use of fixed fyke nets as an alternative to seine netting. There are no details of whether they are considered a success or not for as usual FMS refuse to answer any enquiry, even under FOI.
What is available are the results of fyke net sampling as part of the wider sea lice programme. Interestingly, the number of fyke net samples for 2023 is much less than for 2022 leading to the conclusion that perhaps fyke netting has not shown any improvement over seine net sampling.
I have analysed the data from 2022 comparing the total seine net samples with those from the fyke nets. The seine net sample of 1160 fish consisted of 60% fish that were lice free. By comparison, the fyke net sample of just 291 fish consisted of just 25% lice free fish. The discrepancy between seine and fyke sampling could be down to the different locations rather than sample size. However, one site, Camas Na Gaul, sampled with both nets. The seine net yielded 208 fish of which about 25% were lice free, whilst the 135 fish caught by the fyke net produced just 10% lice free fish.
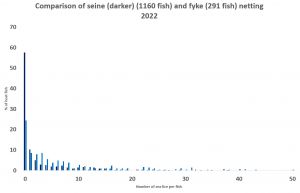
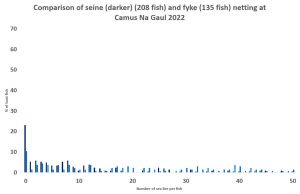
The results of this preliminary analysis suggest that whilst seine netting has its issues, it is still a better way to sample for sea lice infestation than the fyke net as the graphs show.
Finally, I have been talking to some specialist statisticians to try to work out what sort of numbers of fish should be caught as a sample to ensure a reliable measure of sea lice infestation. Their answers suggest that it may be extremely difficult to arrive at a set number. Their advice was to obtain the largest sample size possible and repeat as many times as possible.
All too often claims about the impact of sea lice are based on observations of just one or two fish, especially those with numbers up to 500 lice. The reality is that in this sample of 5,178 fish, just 114 have lice counts of over 100 lice (mainly juvenile stages). That’s about 2% which is around the figure of mortality determined by Jackson et al 2013.
Lighting up time: Meanwhile, the proposed gradings have been published for the Norwegian Traffic Light system for 2024. Two reports have been recently released into the public domain. One is the summary analysis of sea lice infestation across all the production areas from the Institute of Marine Research whilst the other is the latest report from the Norwegian Expert Group.
Two short sections from the Expert Group report attracted my attention. The first refers to the limit value for the infestation level of sea lice on wild salmon. They say that based on the best available knowledge, Taranger (2012) has proposed the following limit values for salmon smolts and first-time migrating sea trout of less than 150g. These are:
100% of individuals with more than 0.3 lice per gram of fish weight will die. For 0.2-0.3 lice/g it is 50% mortality, for 0.1-0.2 lice/g it is 20% whilst those fish with less than 0.1 lice/g all fish will survive.
These numbers are repeated in Taranger et al (2015) which summarises the 2012 IMR/Veterinary Institute report.
The Expert Group do say about the 2012 report that the threshold levels are based on relatively few laboratory tests and field assessments and the values must be regarded as indicative and as first-generation indicator values. They also repeat Taranger’s comments that more attempts are needed for further verification and validation. Ten years on, the limit values have, to the best of my knowledge, still not been verified or validated yet these limit values are still used in Norway (and Scotland) to assess the impact of sea lice on wild fish.
Whilst the Expert Group refer to some aspects of the 2012 report, they fail to mention others. For example, the 2012 report states (in translation):
“It is assumed that the sample size is sufficiently large (preferably at least 100 fish), that the fish are collected during the main part of the emigration period and that the collections are concentrated in the outer parts of the emigration route so that the actual infection pressure experienced by the fish is best represented.”
I currently only have access to the summary report as IMR refuse to share the raw data with me, but it appears that across all thirteen production areas, there were 92 weekly samplings and of these 10 achieved a catch of more than 100 fish. That means that 89% of sampled fish did not meet the Taranger recommendation for minimum catch size. I suspect from looking at historic data, that the number of actual samplings will be greater than the 92 quoted here and that the percentage catch of 100 fish or more will be much less. What I don’t know from the summary data is how many attempts were made to catch the fish during each of the 92 weekly samplings. This information can only come from the raw data.
The summary data also allows me to take a wider look at the total number of fish sampled. This ranges from 51 caught in just one week in PO 13 to 2,122 caught over 26 weeks (8 weeks over multiple locations in PO4). I am unable to understand how fair comparisons can be made between each of the production areas with such variation is the sampling and the number of fish caught.
Finally, the Expert Group report includes a section on the group’s interpretation of the estimated salmon induced mortality based on Taranger’s limit values. This section includes citation to five references from two authors. One is cited three times, and the author just happens to be head of the Expert Group. How can the group’s judgement be seen to be independent when the research used is that of the Group themselves.
The Expert Group’s leader is cited 26 times in the text referencing 13 papers of which he is lead author of eight. IMR’s main sea lice researcher, who is also part of the Expert Group, is cited only twice but he has co-authored 18 of the papers listed. Clearly, some of the experts will have been involved in research but the group leader should be more independent otherwise any conclusions will inevitably be linked to the groups own research to the exclusion of others.