What science?: The Scottish Government website states in a Summary of the Science of the impacts of sea lice on wild Scottish salmon and sea trout that:
The body of scientific information indicates that there is a risk that sea lice from aquaculture facilities negatively affect populations of salmon and sea trout on the west coast of Scotland.
This is the conclusion of a summary of the evidence from peer-reviewed literature to inform assessment of the risk and effect of lice arising from salmon farms on Scottish wild salmonids. The summary also states that the aim is not to repeat existing reviews but to provide a succinct account of key information relevant to locating fish farms in the Scottish coastal zone. Marine Scotland Science cite three existing reviews, yet they are all Norwegian and thus it is debatable how relevant they are to what happens in Scotland. Certainly, MSS have in the past questioned the relevance of Norwegian data as they insisted on conducting their own Scottish smolt release experiment saying that Scotland could be very different to Norway. It turned out that Scotland was very different to Norway because the Scottish study proved to be an abject failure.
The Summary of Science includes both observational and experimental data, of which I will consider the former here.
I take observational data to mean that a clear relationship can be seen between sea lice on salmon farms and an associated decline in the number of wild fish either locally or regionally. This is distinct from the modelled predictions which now seem to dominate sea lice research. A prediction of mortality is very different to actual mortality.
The section on observational data cites three scientific studies from 2003, 2008 and 2009, meaning they are now between fourteen and twenty years old. The Summary of Science was updated on 12th March 2021 so clearly no new data has been generated since that MSS considered worth including in the summary. As this is a section on observational data, I would make an observation that the first reference cited is actually incorrect. The summary refers to a paper by Butler & Watt (2003) but the reference (including the paper title) is for a paper by James Butler (2002). I have raised this error previously, but MSS are clearly not interested in ensuring their review is accurate.
The Summary of Science states that Butler & Watt (2003) found densities of juvenile salmon to be lowest in west coast rivers near aquaculture sites. However, this is a very simplistic statement about a paper that now raises many issues. The paper’s abstract states that 38 rivers are assessed, yet the table showing juvenile assessment lists only 35, of which 16 were not surveyed in 2001. This means that their conclusion is based on just half the rivers stated. In addition, comparison of the average length of rivers with farms with those without shows that the former rivers are 14 km long compared with 24 km for rivers without farms. However, even these figures are misleading as one river with a local farm is of a size three times that of the next largest. If this river is excluded, the average length drops to just 9km compared to 24km. These rivers, the shortest of which is only 2 km, have little potential for any abundance of juvenile salmon simply because they are so short.
Butler and Watt also looked at 14 rivers where severe stock collapses had been identified. Of these 12 have an average length of just 3km. Twenty years on, it is not easy to assess the state of these rivers now, but it is possible to assess one of the other two rivers, the river Scaddle, with an accessible length of 23 km. According to this paper, the Scaddle was reassessed in 2001 as being threatened with a total loss of salmonid fish, which according to Butler & Watt, is likely to be the result of salmon farming and especially sea lice.
It is only recently that MSS have permitted data to be released on individual rivers so usually, it is only possible to look at data at the fishery district level. The Scaddle fishery district consists of an area which is primarily covered by the River Scaddle. The following graph is the number of salmon and grilse caught within the Scaddle fishery district.
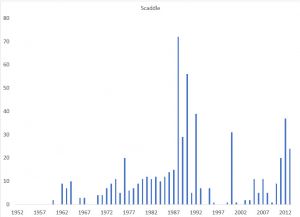
Since Butler and Watt published their paper, catches have actually recovered despite the continued presence of active salmon farms in Loch Linnhe. The nearest farm, which has been present in the loch for coming up to forty years, is less than 3 km further up the loch from the river. Their prediction of a total collapse failed to materialise. How many of the other rivers have also showed some recovery since.
There is much more to write about this paper, but one point worth highlighting is that ten years after it was published, MSS published a paper saying that sea lice could infest wild fish up to 30 km from a farm. This means that all the rivers used in the study that the authors claimed were free of the influence of salmon farming, actually were not.
The main take-home message from this paper is that it is now seriously out of date and new information about river catches, which MSS use as a measure of abundance, invalidates its use as part of this observational data.
The second paper was written in 2009 and was a joint venture between Scotland and Norway (Vollestad et al 2998). According to the Summary of Science, the Scottish coast was divided into three sea areas – the North Sea, The Atlantic and the Irish Sea. They say that catches of salmon declined after the 1980s on the Atlantic coast relative to elsewhere, However, MSS stress that this did not prove a causative link with salmon farming. Surely, if no causative link can be proved, then this paper has no relevance in this summary, especially in relation to sea lice. Regardless of this statement, the paper is significantly flawed, not least because the Atlantic coast also includes rivers many miles from the nearest salmon farm. There are also major questions about which rivers were selected for use in this study. Selecting a different set of rivers has been shown to have a very different outcome.
The Summary of Science states that the third paper – Ford & Myers (2008) compares indices of salmon abundance (catches) on the east and west coast together with farm production. They found a relative reduction in the catches and counts on the west coast correlating with increased production of farmed salmon.
In the paper, these findings are only expressed graphically. The first relates to catch data:

The red line is salmon farming production, and the blue line represents catches from Scotland’s west coast. It can be seen that the declines start before the arrival of salmon farming, a point acknowledged in the paper, but the most important point is that the black line represents east coast catches, an area where there is no salmon farming, which is also clearly in decline too. MSS say that the reduction of catches on the west coast correlate with increased farm production, but clearly there is a similar correlation with catches from the east coast. In fact, there is a parallel decline of catches on both Scottish coasts. How can this be blamed on salmon farming?
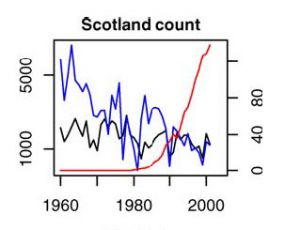
This second graph shows data from east and west coast salmon counters. Clearly west coast counts have declined more than those of the east coast, but the decline occurred long before the arrival of salmon farming. In fact, the count data from both coasts merges towards the end of the time series re-enforcing the parallel decline of salmon in both coasts.
Although, MSS cite three papers that are supposed to provide observational data that supports the view that salmon farming has a negative impact on wild fish, all three papers clearly fail to do so. If the science in this section of the summary can be so easily dismissed, what does it say about the rest of the key information that they say is relevant to the location of salmon farms. Certainly, the experimental data cited is also suspect, but that will be discussed at another time.
In the face of the absence of any observational evidence from peer-reviewed papers, it is worth looking at the raw data. This is data collected by MSS from river proprietors who report the number of salmon and sea trout caught by anglers on their section of a river. The data has been collected since 1952.
The following graph is the salmon & grilse catch from rivers in the west coast Aquaculture Zone from 1989 to 2000 expressed as a five-year average. It shows a clear decline in the number of salmon caught over this period.

Although not peer-reviewed, MSS published a report in 2016 titled ‘Using Catch Data to Examine the Potential Impact of Aquaculture on Salmon & Sea Trout’. This stated that “Analysis of the catch statistics is consistent with an impact of salmon farming on wild salmon”. This statement refers to the short period covered in the graph.
The decline represents a loss of a total of 4,606 salmon.
However, the complete time series of these catches from 1952 shows that this is not the only time catches have declined.
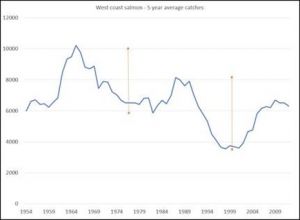
There was a decline in catches prior to the arrival of salmon farming which amounted to a loss of 4,365 fish, a difference of 241 fish. Is this fall in catches also consistent with there being an impact from salmon farming? The answer is no because there was no salmon farming at all for most of this period. Did MSS or its forerunners investigate the decline? The answer is no and why not? The answer is because there wasn’t anyone convenient, such as salmon farmers, to blame.
Two points arise from this graph. Firstly, if salmon farming is responsible for declines, why have catches increased after each decline – in the case of the first fall, salmon farms had now started to appear in number and after the second when the industry was still rapidly expanding. Secondly, the report clearly states that the decline “does not prove a causative link’.
The report also states that ‘Broad scale comparisons of catch data (East/West, farming/non-farming) is not ideally suited to providing evidence of any impact of fish farming.’ The report continues ‘It is very important to note that analyses of fishery catches cannot be used to prove whether or not fish farming has an impact on wild fish as there are many other factors that might cause change.’
This report was written by Marine Scotland Science, yet Marine Scotland Science’s Summary of Science cites two papers that use such broad scale comparison of East and West and salmon farming areas and non-farming areas. Clearly, they can’t even follow their own advice.
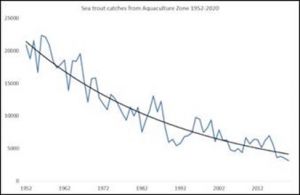
When it comes to sea trout, it can be seen that catches had been in decline for at least thirty years prior to the arrival of salmon farming to the west coast. In their 2016 document, even MSS acknowledge that the sea trout catches have not been influenced by salmon farming.
Could it be that whatever caused the decline from 1950s to the 1980s (no-one bothered to find out why) is the same reason why catches declined after the arrival of salmon farming?
MSS offers the following thought in their 2016 report – ‘catches of sea trout have declined over recent decades on both farmed and non-farmed areas in Scotland and it is plausible that different factors are responsible in the two regions’. However, Marine Scotland Science offer no explanation of what these factors are and why they would differ.
Finally, I end with a look at the fishery district of Clayburn in the Outer Hebrides. The following is a graph of sea trout catches from 1952.
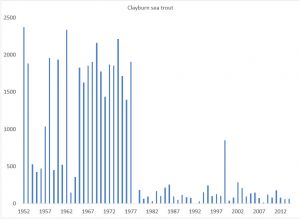
The graph reminds me of a graph promoted in Ireland as showing the impacts of salmon farming on sea trout catches in Connemara.
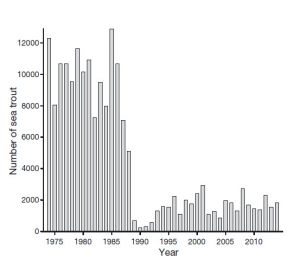
The dates for these graphs are very different with the collapse of sea trout catches occurring in Clayburn in the late 1970s, at least five years before the arrival of the first salmon farm to the area. The collapse was extremely sudden and extremely severe, and it would be expected that such a collapse received significant interest and attention. Despite strenuous effects on my part to discover what happened at Clayburn so many years ago, it seems that there was no interest at all and certainly no attempt was made to find out what had happened to cause the collapse.
Yet, the similar Irish collapse, which happened about ten years later, received massive attention and has been subjected to extensive research. Despite this research, the link with salmon farming remains largely circumstantial.
I have spent at least the last eight years trying to talk to Marine Scotland Science about the Summary of Science, either in its latest or earlier versions, but they have consistently refused to do so. I would say it is unclear why are so averse, yet it is only necessary to take a cursory delve into their review of the science to understand their reluctance. If I were MSS, I would be embarrassed to call this science.
MSS may believe through their review of selective science that sea lice associated with salmon farms may have an impact on wild salmon and sea trout but the evidence from over forty years of actual data from the Scottish west coast tells a very different story. MSS have stated in a published report that many other factors may cause changes to fish populations, so the question is how many other of these factors has MSS actually investigated? Certainly, the biggest factor is, as acknowledged by MSS, the long-term decline since at least 1971 in the number of salmon returning from their feeding grounds to rivers across all of Scotland. In 2017, our future King told an AST dinner that we don’t know why these fish are failing to return and the fact is we still don’t know why. Perhaps, MSS should be asking themselves why this is?