Ewe better believe it!: A couple of weeks ago a disparate group of anti-salmon farming objectors ran a full page advert in a couple of local Scottish papers. The Ferret media website claimed that other local papers refused to accept the advert because they believed that it contravened the Advertising Standards Authority code. This prompted outrage from those who placed the advert claiming their views were being censored.
According to the Ferret, the advert was coordinated by Andrew Graham Stewart of Salmon & Trout Conservation Scotland, an organisation that seems to spend more time attacking salmon farming than doing anything to conserve wild fish. If I am mistaken, I would be more than happy to meet with Mr Graham Stewart to discuss his concerns, but he has always been extremely unwilling to speak to me. Perhaps, he is worried that what I might have to say could undermine his anti-salmon farming narrative.
Amongst other allegations made in the advert is the statement that ‘Where in the world has the growth of intensive salmon farming not coincided with the collapse of wild salmon populations.’
The evidence that salmon farming is responsible for the collapse of wild salmon populations is actually now so tenuous that this statement uses the word coincided to link the two. This word is appropriate because it is exactly that – a coincidence – that wild fish stocks collapsed at about the same time that salmon farming appeared on the west coast. The problem is that the wild salmon lobby and their scientists have been so blinkered to the possibility that there may be another reason other than salmon farming that they have never considered anything else.
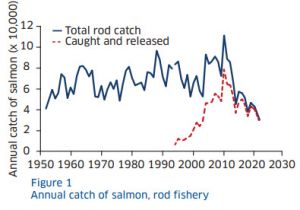
I mention the advert because I have now begun my analysis of the latest rod catch data as published a week ago by the Scottish Government. Given that Government scientists have had at least seven months to process the data, I am always puzzled as to the dearth of information that they publish. In all, there are three graphs. One concerns catch and release, the second concerns the split between catches in the spring and summer/autumn. The main graph shows the change in total catches from 1952 onwards.
What is missing are any details of the catches from the different parts of the Scottish coast. In 2011, the then Scottish Salmon Producers Organisation (SSPO) published a graph showing that the total catch of salmon by all methods had shown a similar decline in areas where salmon farms operated and areas where there were no salmon farms. The then Rivers & Fisheries Trusts of Scotland (RAFTS) reacted by saying that a comparison using rod catch data clearly showed that catches on the east coast had increased whilst those on the west coast (where there were salmon farms) had decreased. Subsequently, my own analyses of catch data suggested that the jury was very much out and there was plenty of evidence to question the connection between wild salmon declines and the arrival of salmon farming.
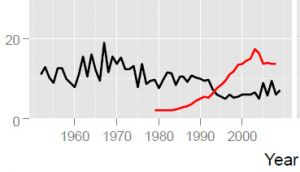
The most significant, and contentious, example was the salmon farm in Loch Ewe. This was even the subject of a scientific paper authored by Butler and Walker (2006) which claimed that the arrival of the salmon farm in the loch had prompted the collapse of the sea trout fishery in adjacent Loch Maree. When I first started to look at the Loch Ewe system which includes Loch Maree, I noticed in the then Association of Salmon Fishery Board’s (now Fisheries Management Scotland – FMS) that the salmon catch was also listed, yet in all the discussions about Loch Ewe and Loch Maree, no-one had ever referred to the salmon catch. Whilst sea trout catches in the Loch Ewe system had declined, catches of salmon had increased. My updated graph of Loch Ewe salmon catches is shown below:
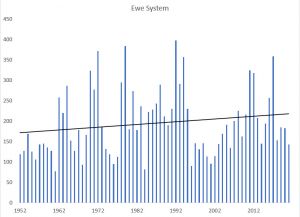
If sea lice from the salmon farm are responsible for the decline of sea trout in the loch, how can salmon catches have increased especially as the farm was so close to the river mouth? As usual with all the questions I have posed over the years, no-one from the wild fish lobby or their scientists has ever been able to provide me with an answer.
Interestingly, the farm was removed from the loch over a year ago and yet the 2021 catch was lower than that from 2020.
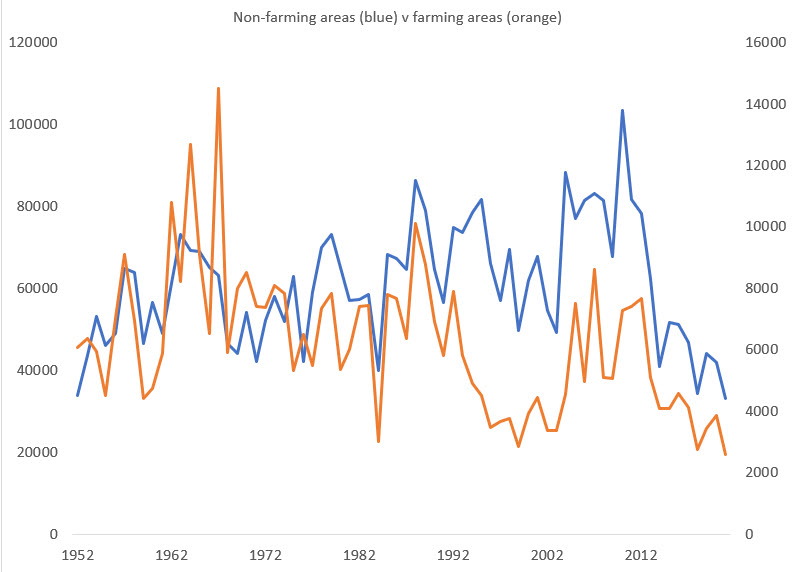
In addition to drawing up graphs of salmon and sea trout graphs for every Scottish fishery district, I did make some comparisons of catches from salmon farming areas and those without salmon farms. In response, Marine Scotland Science (MSS) published a report in 2016 about the use of catch data to measure the impact of salmon farming on wild fish. They said that it is very important to note that the analyses of fishery catches cannot be used to prove whether or not salmon farming has had an impact on wild fish as there could be other factors that may cause changes in fish populations, and these may differ between different regions. Yet, they still managed to state that their graph of catch data shows that from roughly 1990 the farmed areas decline relative to non-farmed areas is consistent with there being an impact of salmon farming on wild salmon.
In fact, the summary of science posted on the Scottish Government website that states that the body of scientific evidence indicates that there is a risk that sea lice from salmon farms negatively affect populations of wild salmon and sea trout. This evidence includes at least two papers that compares catches from salmon farming areas with areas with no salmon farms, even though they say in their 2016 report that such analyses cannot be used to prove whether or not salmon farming has an impact on wild salmon. My interpretation of this evidence and claims is that it is OK to use such comparisons can be used to implicate salmon farming in wild fish declines, but can’t be used to show salmon farming is not responsible.
I have produced two graphs from the latest catch data and readers can draw their own conclusions about the impacts of salmon farming on wild fish. The first graph is my version of the graph produced by MSS in their 2016 report on catch data (I have also included firstly the original for comparison. Their graph includes reference to the growth of the salmon farming industry).
To repeat that MSS state that their graph highlights the decline from roughly 1990 in the salmon farming area. The black line showed the percentage of the total Scottish catch that comes from west coast rivers. I did point out at the time that this way of presenting the data could be misleading as the decline in west coast catches as a percentage could be due to less fish being caught in west coast rivers but equally it could be due to more fish being caught elsewhere. In addition, because the y axis of the graph was shown up to 100%, (not repeated here) the west coast’s catch data appears compressed, making any trends more difficult to identify. My graph simply shows the west coast catch as a percentage of the total.
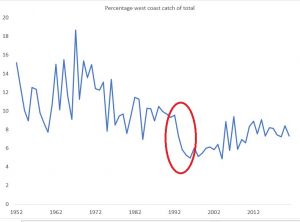
The red oval highlights the time period which MSS say highlights the decline in catches due to salmon farming. However, it can be clearly seen that from the mid-1960s through to the 1990s catches were already in decline. This was before the advent of salmon farming so sea lice from farmed salmon cannot be why catches declined over that period.
What is also of interest is that catches from the 1990s onwards, to the right of the red oval have clearly increased. This is despite the ongoing growth of the salmon farming industry. If catches had collapsed in the 1990s due to salmon farming, why have they not continued to decline?
The second graph shows the actual catch by number of wild salmon from salmon farming areas (orange) and those where there is no salmon farming (blue). The right-hand scale are the numbers for the salmon farming areas.
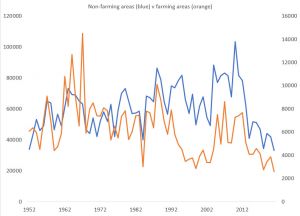
With the exception of the period during the 1990s, the trajectory of the two area is quite similar. The similarity is especially marked in the most recent years, which suggests that recent declines across both areas are for the same reason.
The dip in catches from west coast rivers is not directly related to salmon farming as MSS imply but there is a connection. The reason why west coast catches saw a decline in the 1990s is because the angling organisations were extremely vocal about salmon farming warning anglers that salmon farms had depleted wild stocks, and these were now near extinction. Inevitably, on hearing these dire claims, anglers who might have gone to the west coast for their fishing trip opted to fish elsewhere. Had fishing effort been measured at the time, it would have shown a massive drop in the number of fishers and the time they spent fishing, and this is reflected in the number of fish caught. It certainly does not mean that salmon farming has caused the decline of wild salmon.
As regular readers will know, even SEPA have acknowledged that sea lice from salmon farms are not responsible for the decline in wild fish numbers. SEPA’s head of ecology, Peter Pollard, told the Scottish Parliament’s REC Committee this in November 2020, yet the claims against salmon farming continue unabated.
Despite SEPA acknowledging that salmon farming is not responsible, they still appear determined to impose a risk assessment framework on the industry because this is what Marine Scotland have advised the Minister is what should happen. It seems that the reason why the framework is still on the agenda is because, as Peter Pollard told MSPs, the issue is whether the state of wild fish populations can be affected by the added pressure of sea lice as they migrate to sea. Personally, I do not believe that there is sufficient added pressure from sea lice to justify the cost, the time and effort of this risk assessment framework. I certainly would be interested in hearing from SEPA and MSS how many fish would be expected to be safeguarded by this framework. For example, how much importance do SEPA and MSS place on safeguarding 806 wild fish because this is the number of wild salmon (333) and sea trout (473) that anglers caught and killed from west coast rivers during 2021. Strangely, these numbers appeared buried in the catch data and have not been mentioned by either the wild fish lobby or Government scientists. It seems that if wild fish are seen to be at risk from salmon farmers than draconian measures should be applied but if anglers actually kill the fish, then their impact is ignored.
Finally, it is worth mentioning that whilst FMS have called for action because catches are at an all time low, that at least twelve rivers including the Dee, Don, North Esk, Findhorn, Nairn, Kyles of Sutherland, Brora, Helmsdale, Halladale, Grudie, Lochy and the Doon appear to have produced higher catches of salmon in 2021 than in 2020. Of course, it is possible that changing catch effort has a part to play in this as well as other factors. The one river which is of most interest is the Doon, on the Ayrshire Coast, because in Late 2016, the Times newspaper reported that a famous beat on the river had been closed because there were not enough fish for anglers to catch. The newspaper reported that the previous year only 27 fish were caught from the beat. When the beat was bought during the 1990s, the average catch was 469 fish. This dropped over the next five years to 243 and to 190 in the five years after that. The proprietor told the paper that he was witnessing the extinction of wild salmon and blames salmon farming as well as the Scottish Governments failure to legislate for the control of sea lice.
The 2021 season annual report was summarised as the best season since the crash in 2015 when catches dropped by 50% to 300 per season. The total catch for 2021 is reported as 498 fish. The following graph is taken from the FMS annual review.
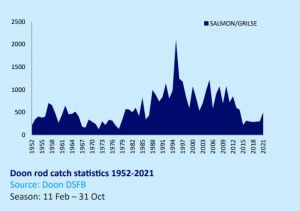
What is interesting is that whilst the Doon Fishery Board claim a 2021 catch of 498 fish, the Scottish Government spreadsheet for the Doon adds up to just 447 fish, a deficiency of 51 fish. Given that the catch data is provided by the same proprietors, why there is such a deficiency is a real puzzle. I have been aware of similar discrepancies in the past but never really followed them up because the ones I have seen have been relatively small. Out of interest, I have compared the declared catches from the 34 river catchments that appear in the FMS Annual Review and that can be matched with districts listed in the Scottish Government official catch data. The official data reveals a catch of 27,906 salmon but the total catch from FMS Annual Review is 29,016, a difference of 1,110 fish.
Some of the entries in the FMS Annual Review say that they are provisional results but if this was the reason for the difference, it might be expected that the catch would be lower, not higher than the official statistics. If the difference for just 34 fishery catchments is 1,110, what potential difference could there be for all 109 districts?
If the salmon boards and trusts cannot get the number of fish caught to agree with the official declared catches, then the question must be asked as to how reliable is any of the data they produce?
I suspect that FMS and their members are too busy pointing the finger at salmon farming in the hope of distracting attention away from their own deficiencies.
Meanwhile, the collapse of River Doon catches in 2015/6 was blamed firmly on salmon farming. Six years later the river appears to have rebounded even though the salmon farms are still present and despite the fact that salmon catches across Scotland are at an all time low.