There’s the catch!: Fisheries Management Scotland published their 2021 Annual Review on March 23rd 2021. This year, the review finally appeared on May 19th nearly two months later than the previous year. Perhaps they should have waited even longer because most of the catch data provided in the review is just provisional. Given that most of the fishing stopped by the end of October, why does it take so long to add up the catch, after all salmon farmers are expected to report some parameters on a weekly basis. Why cannot river catches be reported weekly with a full report by the end of the year? As it is, the official Marine Scotland data is not due to be published until June 1st, eighteen months after the fishing season began.
I will discuss the review in a future issue of reLAKSation, probably once the full catch data is published.
Scaremongering: The Scotsman and STV News both reported about the race to save Atlantic salmon from extinction as salmon stocks have plummeted by 75% since the 1980s. Mark Bilsby of the Atlantic Salmon Trust told the Scotsman that he didn’t think it was scaremongering to say that there’s a fair chance we will lose them (Atlantic Salmon) from Scotland and the UK in our lifetime if the decline is not reversed.
Mr Bilsby was talking to the Scotsman about the West Coast tracking project, whilst his colleague Dr Angus Lothian spoke to STV about the Moray tracking project. These ‘groundbreaking’ projects are aimed to ultimately shape policy, reverse the downward trend and increase stocks.
Mr Bilsby’s comments prompt a couple of questions. The first is that we already know from ICES data collected for NASCO that the number of salmon returning to Scottish waters from marine feeding grounds has been in decline since at least 1971. Fifty years on, why are we now only conducting these ‘groundbreaking’ projects to find out why they are in decline? Why weren’t there projects during the 1990s or 2000s for example. The answer is simple. Until 2011, anglers were catching plenty of fish and therefore it didn’t matter if fewer fish were returning. After the peak catch in 2010, there was hope that the subsequent decline in catches might recover, but they didn’t. Eventually, something had to be done and these tracking projects are the result. Sadly, they are not looking at the underlying issue of why the number of returning fish have been, and are still in decline and thus they will not offer any real solution to stock recovery.
The second question is, if Mr Bilsby is so concerned about the fate of wild salmon, then why doesn’t he call for a complete ban on killing wild salmon in Scotland, if not a complete ban on all forms of exploitation.
Yet, although the angling fraternity claim that catch and release has increased to the highest level ever, it is not universal. At the beginning of May, the River Garry announced that after 25 year’s policy of 100% mandatory catch and release, the decision has been made for 2022 to relax these restrictions in line with the wider Ness system. In addition, more rods will be allowed (increasing fishing pressure) and at the same time ticket prices will be reduced. It’s not all bad news for salmon in the Garry because those anglers that do release any fish caught will receive a £10 payment for doing so.
Meanwhile, the main remedial measure to help safeguard salmon adopted by some fishery boards is to plant trees. The idea that the shade eventually created will help prevent the rivers warming as the climate changes.
However, one aspect of this strategy has occurred to me and that is that rivers may not be just warming from hotter summers etc but as the water comes down from the high grounds, they may already be too warm. The lack of snowmelt will mean that the gathering river water is not as cold as it used to be. The water may be already too warm long before it reaches any of this newly created shade.
Perhaps, rather than invest in tree planting the various fishery boards should consider in investing in the snow making machines seen at the most recent winter Olympics.
Apologies: I wish to apologise for continuing to pursue the theme of the aggregated nature of the way sea lice are distributed amongst their host fish in this reLAKSation viewsletter. I have tried to discuss this subject with Marine Scotland Science with not much success. However, I did receive the following comment, which I don’t think answered my concerns:
“We can assure you that the aggregated distribution of lice is specifically accounted for in papers referenced in the Summary that have analysed data on sea lice infestation of sea trout collected by local Fisheries Trusts with funding from Marine Scotland (Middlemas et. al 2010, 2013). These papers show that levels of lice on wild sea trout decrease with distance from farms (once necessary factors are accounted for) and are substantially higher during the second years of farm production, when levels of lice on farms are higher. These papers considered the percentage of the trout populations with sea lice above the threshold level believed to cause very significant damage. This analysis approach was specifically to account for the over-dispersed poisson (aggregated) distribution.”
The first thing to say is that the only mention of either aggregated or over-dispersed distribution appears in just the second paper, and this states that ‘overdispersion is the presence of greater than expected variability in a data set’ and it refers to the need for a mixed modelling framework. What it doesn’t say is that parasites such as sea lice are distributed in an aggregated or over-dispersed manner. Neither of these papers specifically account for an aggregated distribution unless Marine Scotland Science believe that distance from a farm and higher second year infestation are examples of aggregation, which they are not.
Yet, both papers state results which are clear examples of this aggregated distribution but without reference to the fact.
In the 2010 Middlemas paper, 784 trout were sampled with 372 fish (47.4%) carrying lice (therefore 52.6% fish were lice free) and 90 fish (11.5%) had lice burdens above the Wells (2006) threshold.
In the 2013 Middlemas paper, 6,590 trout were sampled with 3,462 fish (52.5%) infested with lice (therefore 47.5% fish were lice free). Of these 6,590, 4,867 were below the Wells (2006) size threshold and of these 4,867 trout, 2,273 fish (46.7%) were infested with lice (therefore 53.3% of fish were lice free) and 612 (12.6%) were infested above the Wells threshold and at risk of mortality.
Both these sets of results are classic aggregated distributions with 52.5/47.5% of the fish carrying no lice whilst just 11.5/12.6% were carrying enough lice to be considered at risk if the results of the Wells (2006) risk paper are considered to be correct. Whether this lab-based experiment translates into the wild is questionable.
When the whole data set of sea trout data collected by the Fisheries Trusts from 1997 to 2019 is analysed, 20% of the fish are infested with 13 or more sea lice but when only mobile lice are considered as determined by Wells, then just 8% of the fish carry sufficient lice to be considered at risk. I am at a complete loss to understand how this low risk of mortality is not reflected in the MSS Summary of Science or in the commentaries put out by the Fisheries Trusts. I have previously written about Lochaber Fisheries Trust who claim that 85% of migrating fish will have died in 2021. The actual data does not support such claims. The reality is that the risk to migrating fish from sea lice is being highly overstated simply to maintain a narrative that salmon farming is harmful to wild fish.
What is most surprising is that both Marine Scotland Science, the Fisheries Trusts and Fisheries Management Scotland have absolutely no excuse for not knowing about the aggregated nature of sea lice distribution amongst sea trout. Between 2011 and 2015, the now defunct Rivers and Fisheries Trusts of Scotland (RAFTS) published annually a review of their wild fish monitoring programme. These five reports are still available through the FMS website – https://fms.scot/fish-farming/publications-and-data/
Under the section heading – Sweeping Survey Techniques and Data Analysis – RAFTS state:
As highlighted by Hazon et al 2006, parasite infestations of hosts generally do not show a normal distribution of variation among individual hosts. Typically, parasite populations show “overdispersion”, or “aggregation” on certain individual hosts (i.e. many or most hosts are parasite free, but a small number of hosts carry exceptionally heavy infestations).
This cannot be any clearer, so I ask why is this explanation so ignored? Presumably it is because it totally undermines the view that sea lice from salmon farms are significantly impacting wild fish populations.
What makes this even more interesting is the reference to Hazon et al (2006). This is a report entitled ‘Sustainable management of interactions between aquaculture and wild salmonid fish’ otherwise known as SUMBAWS. The reference is the final report for an EU funded collaborative project between seven institutions that costed €2.37 million. The project ran from 2002 to 2005 and the results were published in 2006 as a 293-page report. This can still be found on the internet at:
https://issuu.com/inshoreirelandpublishing/docs/4-ms-sumbaws_final_pdf_doc/1
The report is co-authored by eight researchers from Scotland, Ireland and Norway and page 228 is the source of the statement found in the RAFTS reports, but what makes all this interesting is that in 2015, Eva Thorstad from NINA in Norway and who is the leader of the Norwegian Scientific Council for Salmon Management published a major literature review of the effects of sea lice on wild sea trout. Dr Thorstad co-authored the 23-page review with nine other researchers from Norway, Scotland and Ireland, four of whom were participants of the SUMBAWS project. Yet despite this expertise, there was no reference at all to the aggregated nature of how sea lice are distributed amongst their hosts or even to the SUBMAWS report.
Dr Thorstad and one of the SUMBAWS researchers, Bengt Finstad were subsequently commissioned to produce a report about the impacts of sea lice for Salmon & trout Conservation. Not unsurprisingly, no mention of the aggregated distribution of sea lice appears in the report.
In addition, 2016, Marine Scotland Science published their Summary of the Science in 2016, a copy of the original version is still available on the S&TC website. The ‘Hazon et al 2006’ reference is not cited and therefore there is no mention of sea lice’s aggregated distribution, even though this is a summary of sea lice science.
Finally, Rivers & Fisheries Trusts of Scotland (RAFTS) was wound up at about the same time that the Association of Salmon Fisheries Boards evolved into Fisheries Management Scotland. This brought an end to the run of sea trout sampling reports although one final report was published in January 2018 for the 2017 data. The report doesn’t say who authored it, but the key point is that the reference to the SUMBAWS report and the mention of aggregated distribution was removed from what otherwise is the same report as from those produced by RAFTS.
It seems that discussion of aggregated distributions has been erased from the sea lice narrative because it is not compatible with the wider commentary about salmon farming.
Sampling: The correspondence with Marine Scotland mentioned above referred to two papers about higher sea lice infestation of sea trout sampled nearer farms and those sampled when the local farm is in the second year of production. These were cited as examples where aggregated distributions were considered, but I am not convinced. I am especially concerned about the size of the sample and how this relates to the wider population.
As readers of reLAKSation are aware, I recently obtained the sea lice counts for 21,000 sea trout sampled by the Fisheries Trusts from 1997 to 2019. The data is published alongside a link to a netting protocol produced by the Scottish Fisheries Coordination Centre along with representatives from Marine Scotland Science. The protocol says to aim for a sample size of a minimum of 30 fish, although there is no explanation of why 30 fish are the minimum required. My own view, after reviewing the twenty two years of sampling is that 30 fish is insufficient for any meaningful assessment of the spread of infestation. It seems that the more fish that can be caught, the more the sample will reflect the actual aggregated distribution. The smaller the sample, the likelihood is that the fish will represent just the small number with high infestation levels. Smaller samples also increase the likelihood that the prevalence figure (the percentage of fish infested with lice) will be high.
The 2010 paper cited by Marine Scotland relates to the observation that lice counts on local sea trout are higher in the second year of production. It would not be unexpected for farmed fish in their second year of production that are not treated against sea lice to have higher sea lice counts. The question is whether local wild fish have higher counts too. It is possible that those fewer fish infested with sea lice might have higher counts, but it doesn’t mean that more fish overall are infested. Certainly, the expectation of an aggregated distribution is that they wouldn’t be. What is critical for such determination is the size of the sample. As already discussed, the SFCC say that there should be a minimum of 30 fish yet 50 percent of the samples used in the analysis for the 2010 paper fall below this minimum figure. The smallest sample size was just 14 fish, less than half the recommended minimum. In my opinion, this paper fails to support the claims made simply because there is insufficient data to draw the conclusions made. Yet, Marine Scotland Science, whose paper it is, continue to claim in the Summary of Science that sea lice counts on wild fish relate to the stage of farm production.
One of the reasons I wanted to access the sampling data was to look at this relationship for different sites over longer periods of time than considered in the 2010 paper. I am still analysing the data but whilst some sites/periods do show significant year to year variations, other don’t.
The second paper relates to increasing sea lice counts with increasing proximity to a farm. This paper quotes a figure of 31 km below which there is an effect, and this figure of 31 km is widely quoted by the critics of salmon farming. They ignore that the paper clearly states that there was considerable uncertainty around the cut off distance with a range of between 13 to 149 km.
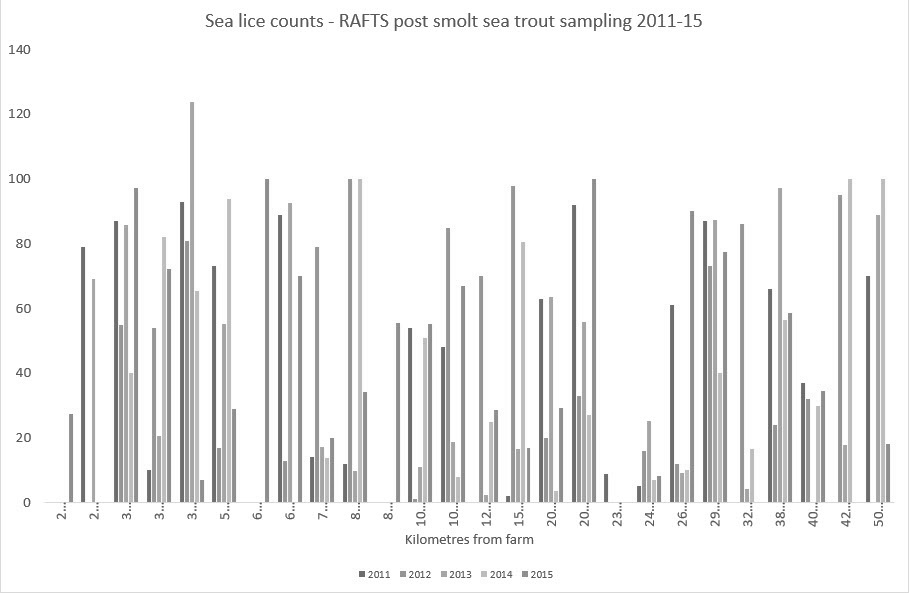
Readers who have been kind enough to buy a copy of my book – Loch Maree’s Missing Sea Trout (Amazon) – may remember that I have already addressed this issue. The 2013 paper used data from sampling between 2003 and 2009 but this data was (and still is) inaccessible to me. As an alternative, I used the summarised data available in the RAFTS reports from 2011 to 2015. These reports contained a graphical representation of average infestation, but this was grouped in geographical location for each trust.

I took all the data for each of the five years and instead displayed the sites by increasing distance from a farm. Those sites on the left are nearest a farm whilst those on the right are further away.

Clearly, there is no discernible pattern to the lice infestation with some of the highest counts from sites the furthest distance away from any farm.
I am still working through the data and will report back when I’ve finished. This may take some time as I have to fit this work around my day-to-day business activities.