World leading data scientist 1: I recently wrote about an article that appeared in the Herald newspaper on August 9th. This reported that figures compiled by campaign group ‘Inside Scottish Salmon Feedlots’ (ISSF) show that mortality rates on individual farms reached as high as 78% in 2020.
The ISSF Facebook page states that their databases have been compiled over three years with information gleaned from publicly available sources. In reLAKSation no 1033, I wrote that even though I used such publicly available data, I was unable to reproduce the same mortality figures as ISSF.
The salmon industry report monthly mortality and biomass data to the Scottish Aquaculture website managed by SEPA. Yet however this data is treated, the outcome for each farming site is different to that produced by ISSF. As I previously pointed out, biomass is ever changing and whilst the monthly data is accurate, it is not so easy to relate it to the biomass on an annual basis.
In addition to the Scottish Aquaculture website data, significant mortality events are recorded on the Scottish Government Fish Health website and whilst these show mortality for one off events, they do not include the low-level mortality that can occur on farms. It is therefore impossible to use this data to draw any conclusions about the annual mortality for each site.
Finally, the SSPO publish monthly mortality data based on numbers of fish, but the raw data is not publicly available, so this is not a potential source for the ISSF analysis.
I mentioned that I am not a statistician whereas ISSG state that they have the expertise of a world leading data scientist who presents that data in real world terms that everyone can understand. I certainly understand the figures; I just don’t understand how they were calculated.
In a recent posting on Facebook, ISSF responded to my comments saying that I was unable to comprehend how their complex algorithms calculated the annual mortality rates for each site. They have pointed out that whilst I might be sceptical of their figures, they in fact agree ‘almost exactly’ with the figures published directly by the salmon farming industry. I simply pointed that as with all science, there needs to be clarity as to the methods used.
ISSF say that the SSPO handily provide an explanation of their (SSPO’s) figures. The cumulative mortality over the full production cycle is expressed as the percentage (although this should be the number) of fish that have died on farm during the entire production cycle as a percentage of the total number of fish that were initially stocked on the farm. This can only be reported once the farm has been fully harvested.
I would like to thank ISSF for the explanation, despite not being so clear, however, I am aware of how this is calculated. What I questioned was which raw data did ISSF use in their calculation?
It is now some time since I looked into this data, and I can now report that I have finally cracked ISSF’s complex algorithms and arrived at exactly the same figures as theirs. I have produced a table almost the same as their 96 farms report. Mine is slightly different as I have data for two extra sites that ISSF appear to have missed.
I would like to say that whilst at first it was a bit of a struggle to understand ISSF’s complex algorithms, in the end it proved remarkably easy. I went to the SSPO website and opened each of the twelve-monthly mortality reports and selected the data from the column headed ‘Cumulative mortality over the full production cycle (%)’.
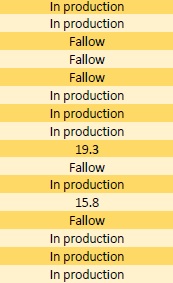
I then took the figure from each site that ended its cycle and put it into a table ranked by order of magnitude. ISSF says that their data agrees almost exactly with the industry data, however they are mistaken. Their data exactly matches the industry data because it is the industry data. This didn’t require any complex algorithm at all, just the reported industry figures.
However, any mortality data needs to be put into context. In the case of the SSPO data which uses numbers of fish, the data does not distinguish between a 50g fish or one of 3kg. Obviously losing 1,000 3kg fish is a greater issue that 1,000 50g fish. By the same account, biomass can also be misleading because it measures the weight of mortality not the number of fish and 100 3 kg fish is recorded exactly the same as 6,000 50g fish. It is therefore possible that mortality recorded as biomass and that of fish number might be very different. Equally, as ISSF have highlighted, every farm has potentially a different production cycle and just equating mortality to the calendar year from January to December can be misleading too. It is for this reason, that I asked ISSF to qualify the source of their data and how it was applied because as with scientific reporting, it needs to be made clear exactly what is being reported.
However, as ISSF simply wanted to portray the industry in the worst possible light, they have highlighted the one farm with a 78% mortality. This is manna from heaven for them because it can make headline news in the media such as the Herald article, even though it is not typical of industry production.
World leading data scientist 2: Inside Scottish Salmon Feedlots (ISSF) willingly shares data with their Facebook followers but provides no reference as to its origin. Real science requires the use of references but as ISSF only employ a data scientist, they may not be so familiar with the scientific method.
It’s funny how the salmon farm industry critics readily use data that is acceptable to their narrative but criticise data used by the salmon industry which comes from independent sources. A case in point is the graph of sea trout catches from rivers within the Aquaculture Zone constructed using Marine Scotland Science data. The graph shows that sea trout catches were in decline long before the arrival of salmon farming yet, some of the critics have mocked the use of this graph. Strangely, not one of the wild fish organisations has been willing to explain what cause the decline before the arrival of salmon farming to the region.
It is worth pointing out that ISSF was developed by those with an angling background, which is why a recurring image on their pages is captioned ‘Salmon farms – killing wild Scottish salmon’ but provide no evidence to support this claim. As always, context is important.
In this commentary, I will respond to some, but in the interests of brevity, not all, of the statements made by ISSF:
- Approx one farm for every 10 miles of coastline.
Marine Scotland Information sheets states that Scotland’s coastline is 18,743 km long (at high water). This equates to 11,646 miles. If there are one farm every 10 miles, then there must be 1,165 farms in Scotland. The 2020 Survey of Scottish Aquaculture states that there were 266 active farms operating, some 899 less than ISSF suggest. Perhaps ISSF refer to part of the Scottish coastline, but they have not qualified what this is.
- Little or no life on sea floor around each farm for up to 2.5 km.
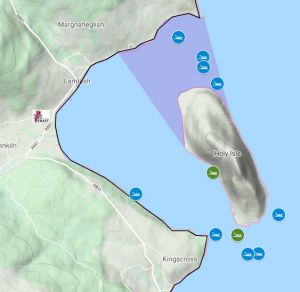
This statement is harder to refute as I am unaware of any wide-ranging surveys outside those required by SEPA. However, I would simply refer to the Coast of Arran Seabed Trust (COAST) who have posted an interactive map on their website that shows the best spots for snorkelling and diving. One area of that offers a number of different snorkelling options is Lamlash Bay, which is coincidentally home to one of the most longstanding salmon farms in Scotland. The farm was first registered in January 1988, which make it 33 years in production. Over such a long time, it might be expected that the local area has been obliterated by over thirty years of waste. As a rough estimate, COAST list ten diving sites that approximately fall within the 2.5 km range. I suspect that there must be a lot more to see than mountains of fish waste.
By coincidence, BBC Countryfile visited Isle Martin this week and featured hand dived scallops from the area around a salmon farm, which was in clear view. The presenter Jo Crowley was amazed by the size and quality of the scallops which were caught by a member of staff from the farm. It is also worth mentioning that this farm was established in 1979 and is one of the longest serving sites in Scotland.
- Government data shows reinfection from unnatural levels of salmon feedlot derived sea lice extend up to 90 miles from farms.
Although ISSF do not state the source of the Government data, I suspect that the 90 miles figure is gleaned by a paper by Middlemas et al. (2013) that was calculated from data collected by local fishery trusts. The paper suggests that farms have an influence up to 31km away, but they state there was considerable uncertainty about the actual distance as the 95% limits gave a range of 13 to 149 km. As we now know from the initial comments from the Overseas Science Group evaluating the Norwegian Traffic Light System, the way this data was collected is flawed. In my book Loch Maree’s Missing Sea Trout, I placed each site in order of distance from the nearest farm and found that infestation appeared random regardless how near the sample site was to an active farm. The 90-mile distance appears to be an extreme distance not the norm. Perhaps, if ISSF used a different source, then the claim can be re-examined.
- Industrial noise which excludes protected seal, dolphins, and whales from large areas on inshore seas.
On 20th August, one of the farming companies posted a video of a pod of dolphins swimming right next to salmon pens. I have previously posted pictures of a minke whale also swimming past salmon pens. ISSF and other critics have everyone believe that the Aquaculture Zone is devoid of protected wildlife, when this is far from the truth.
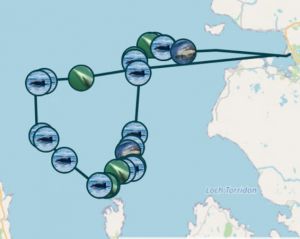
Also by coincidence, ISSF have started posting images taken from tweets by Hebridean Whale Cruises sailing out of Gairloch. This week the images are of several minke whales that were seen to be lunge feeding at the southern end of the Minch. They state that the images of one particular whale taken near Rona were the star of the show! The photos were taken by Steve Truluck.
One of the comments subsequently made on the ISSF Facebook page following this posting states: ‘Unfortunately just round the corner from the whale picture is a large feed lot.’ In fact, there are several farms, which simply illustrates the point that the claims made against salmon farms are extremely over-stated. The images posted by ISSF seems to support the case for salmon farms rather than against them as ISSF would hope.
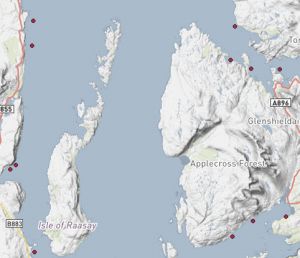
It is also worth noting that the ranger from Isle Martin who was interviewed on the most recent BBC Countryfile highlighted that he had seen minke whales, dolphins, and seals from the Island.
It seems that those opposed to salmon farming get away by making claims for which there is little evidence. What tends to happen is when these claims are challenged, they are usually met with a personal attack rather than any willingness to discuss their issues.
Eco-dance: Ten days after protesting outside Marks & Spencer in London, Ecohustler finally posted their video of the event on their website It certainly looks very different to the video I took but then they used professional recordists and photographers. Their video can be seen at: https://ecohustler.com/culture/the-salmon-dance-mands-petition-hand-in-event
Ecohustler say that thousands of people who have signed the petition are now going one step further and are interacting with M&S on their social media channel. They provide a link to Twitter but I struggled to find more than a handful of comments. Even if there are thousands, why could not some of them turn up to support the protest in person. Instead, there were just a few supporters who bothered to attend. I suspect that this reflects the real level of concern about salmon farming than that conveyed by an online petition that requires simply the press of a button.
Finally, I would mention that the protesters feelings about M&S weren’t strong enough to stop one of them buying a coffee from the M&S store, when there were plenty of other places to buy a coffee nearby.
Australia: The Australian newspaper the Mercury reported about protests outside Huon Aquaculture relating to bids placed by international companies to buy the Huon salmon farming operation. The paper reported that activists dressed up in fish costumes to make their protests known.
The newspaper published a picture of the protest. It seems that these activists share much in common with those attending the recent protest in London. There are hardly any.
The only time when such protests seem to attract people are when NIMBYSM is rife and then it’s not about salmon farming per se but rather they don’t want any developments in proximity to their homes or communities.
