
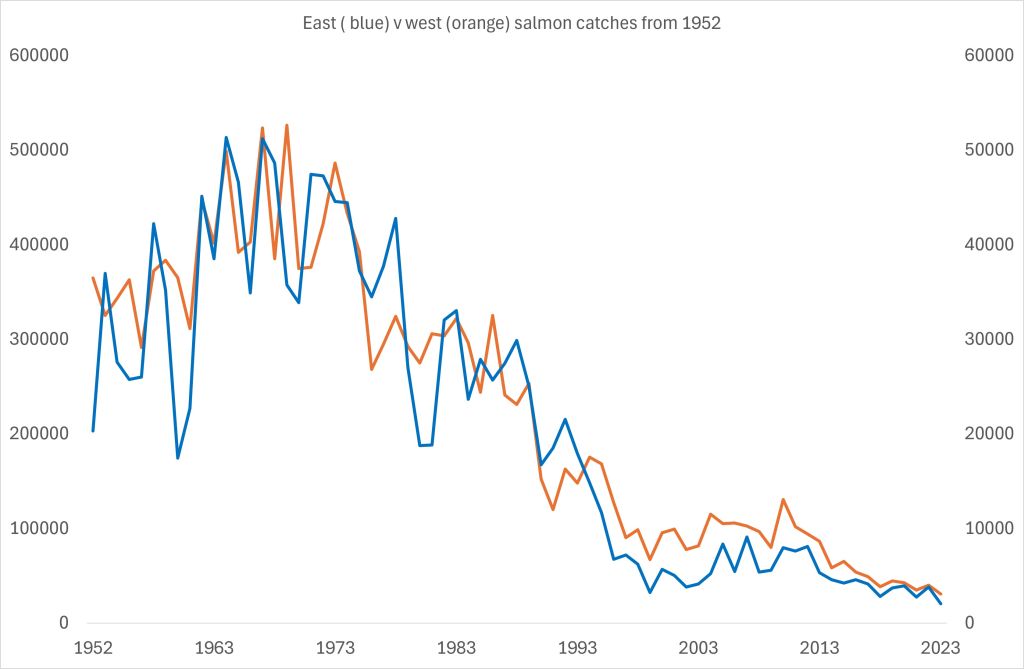
No catch: Regular readers of reLAKSation will be familiar with my graph showing salmon exploitation from what is loosely described as Scotland’s east and west coast but more specifically from areas where there are salmon farms (orange) and areas with none (blue).
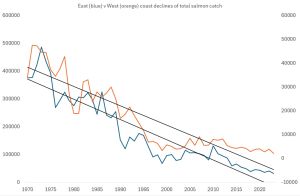
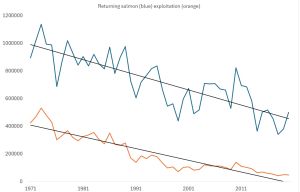
The question is what can we infer from this graph? The obvious answer is the exploitation from both areas are declining at almost the same rate and consequently salmon exploitation is declining similarly across all of Scotland. Certainly, when total exploitation (orange) is plotted against the ICES run data showing the decline in the number of salmon returning to Scottish waters (blue), there is also a similar pattern of decline.
Returning to the first graph, the most observant of readers might notice that right hand y-axis is not centred on zero. This is the way that excel has drawn the graph but if it is put to zero, then the rate of decline of areas without salmon farms slightly increases. This is not surprising given that the areas without salmon farms account for over 90% of the total Scottish catch. The change is however slight and doesn’t really affect overall picture.
Having ascertained that whatever is causing the decline affects all Scotland, is it possible to deduce what is causing the decline? The answer is probably not but what we can say is that something happened in the late 1960s and/or early 1970s that impacted wild salmon and the associated fisheries. We know this because the data clearly shows that from 1952 total exploitation within both areas increased.
The Scottish Government has highlighted several pressures that are affecting wild salmon numbers. These include predation, habitat changes, marine developments and salmon farming. However, none of these seem to be capable of influencing the observed changes over such a long period. In the case of salmon farming, production reached 520 tonnes in 1979, eight years after the ICES run series begins. In 1982, production reached just 1,000 tonnes for all of Scotland. It seems unlikely that salmon farming can be blamed for the continuing declines of wild salmon, especially as the Norwegian scientists claim that upwards of 30% of migrating smolts could die from sea lice infestation. Because the salmon catch from west coast rivers represents such a small part of the total salmon catch, mortality rates of 30% would be clearly obvious and they are not.
If we cannot show that salmon farms are responsible for the declining salmon population, can we say it is not. I would suggest we can, because there is such a minimal difference between long term exploitation rates for both the salmon and salmon farm free areas, which would suggest that there is very little other influence. However, I am willing to be convinced otherwise but so far no-one from either the scientific community or the wild fish sector has been prepared to comment, except one Norwegian researcher who said that a lot more research would be required to make any such deduction. Fortunately, a lot more research has been done and when it is all put together, salmon farming and sea lice do not appear to be the cause. Of course, it is impossible to demonstrate what has caused the deaths of wild salmon but then no-one has yet shown that the fish they claim have died from sea lice actually died as a result of sea lice infestation.
I raise this subject because in circumstances that I cannot discuss right now, I was recently told by a senior Scottish Government scientist that catch data cannot be used to show that sea lice associated with salmon farms are not the reason why wild salmon are in decline.
I don’t agree because 1. I don’t believe that Scottish Government scientists are impartial as in my opinion they favour the angling sector as illustrated by the fact that whilst salmon catches are an all-time low, no conservation measures have been imposed on anglers and in 2026, fishing continues as normal. 2. Scottish Government scientists have said it is plausible for catches on two different coasts to decline for different reasons but after ten years have failed to provide a single example. 3. Scottish Government scientists have not provided any evidence as to why catch data cannot be used. 4. Finally, Scottish Government scientists say that the best measure of the impact of sea lice on wild fish comes from their modelling. Yet, the models are built on assumptions of which the main assumption is that sea lice associated with salmon farms kill wild fish. This is just an assumption.
I was not the first to use catch data to show salmon farming is not guilty of causing the current wild salmon crisis. In 2011, Professor Phil Thomas, then chairman of the SSPO, compared total exploitation from west and east coasts and showed that the decline from each was almost in parallel, Naturally, the wild fish sector was quick to refute his claims. In response, the then Rivers and Fisheries Trusts of Scotland (RAFTS and now part of FMS) claimed that Professor Phil had used data from all the west coast, including the southwest where there are no salmon farms. Actually, Professor Phil did not clarify which data he used, but interestingly, RAFTS carried out the same analyses but using catch data from the area now called the Aquaculture Zone, RAFTS found that the trend remained the same as that identified by Professor Phil.
However, RAFTS said that the way Professor Phil presented the data was misleading and this was because he had included the catches from commercial netting. They say this may sound reasonable but they say the way catches have declined from nets is different to the way they decline from rod fisheries and therefore should not be included together.
RAFTS argue that as catches decline, anglers still continue to fish (even when as now numbers are at an all time low) so the catch can be considered proportional to the decline in fish returning to the river. By comparison, they say that many nets were closed down or bought out which meant that the net catches stop completely so the decline in catches is not proportional to the numbers of returning fish.
What RAFTS say may well be very true if comparing the decline of rod fisheries to that of netting but in Professor Phil’s analysis, the two were added together. In addition, what RAFTS appear to ignore is that the fish that were no longer caught by nets were now reaching the rivers where they were being caught by anglers instead so evening out the total exploitation.
Both Professor Phil and RAFTS opted to measure decline as a percentage of the 1970 catch. RAFTS say that in 1970, the nets took 86% of the east coast catch which subsequently declined by 96%. In the Aquaculture Zone, the nets took 76% of the catch and has since declined by 98% (By 2016 both had declined by 100%) RAFTS say that because the number of fish caught on the east coast is much larger, it makes the decline of east coast fisheries look worse than the west coast. This is a easy problem to solve which is to look at total catch in numbers rather than percentage decline.
Finally, RAFTS say that there is a simpler way to look at the data and that is to focus on rod catch data only, which they say shows an increase in the east with a decrease in the west hence conforming the impact of salmon farms. Sadly, they fail to realise that this effect is simply the result of more fish entering the rivers due to net closures, even though they acknowledge this has happened.
After this exchange in 2011, not much more was said about catch data except the then Salmon & trout Conservation updated the RAFTS graph to include a couple more years of data.
I only came to the ‘catch data’ party in late 2010 and wasn’t really aware of the Professor Phil/RAFTS exchange of views until much later. Instead, I was more interested in the rod catch trends of each of the 109 fishery districts to see whether any changes could be attributed to the arrival of salmon farming. For example, I was interested to see that the pattern of catches for Loch Ewe which showed increased salmon catches but declining catches of sea trout was very similar to that seen in the River Nith down near the English border.
In one of the only comments made by the wild fish sector, Andrew Graham Stewart, then Scottish director of Salmon & Trout Conservation wrote that my comparison was a red herring because unlike the Nith, the Ewe had no large sea trout. Judging by the historic pictures of the very large sea trout taken from the Loch Ewe system over many years, it is not surprising there are not any large fish left. However, as there doesn’t appear to be many fish left of any size, then the comparison is somewhat irrelevant.
Whilst the wild fish sector has consistently tried to ignore my research, it did come to the attention of the Scottish Government as one of the senor civil servants in Marine Scotland requested their scientists to review the issue of catch data and the result was a review document titled ‘Using catch data to examine the potential impact of aquaculture on salmon and sea trout.’
The first point to make about this 4-page document (plus covers) is that it has not been peer-reviewed and it doesn’t cite any published paper that has been peer-reviewed. It is simply the view of three Scottish Government scientists.
It begins by stating that in general comparisons of catch data tend to be made between the west and east coasts whereas a more valid comparison is to make a comparison between salmon farming areas and those without salmon farms, yet in general that is not true. It is possible that Professor Phil’s analysis did compare east and west coast – I simply don’t know – but all the other comparisons have focused on the areas with and without salmon farms. Even so, RAFTS admit that the trend is the same regardless of whether it is coasts or areas that are compared.
The document continues:
‘Rod catches give an indication of the number of salmon or sea trout present in the river and therefore provide a measure of the strength of the populations. They do not, however, give a good measure of changes in factors which are affecting at‐sea survival, potentially including the impact of aquaculture. It is well acknowledged that the relationship between rod catches and actual number of fish in the river stock depends on factors that vary from year to year, such as water flow and fishing effort. However, by examining trends over a sequence of years, much of the short‐term variation in such factors can be smoothed out.’
I agree with these scientists that by examining the trend over a sequence of years, any short-term variation is smoothed out. This is why I have used a 55-year data set. Surely, 55 years is sufficiently long enough to be confident about the overall trend.
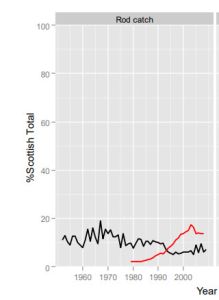
What is interesting is that the scientists use the following example to illustrate their view. The graph is of the Scottish salmon catch from1952 to 2009. The area below the line represents the catch from the Aquaculture Zone fisheries whilst the area above the line is the catch from elsewhere in Scotland.
The scientists conclude:
‘1. From roughly 1990 the farmed areas decline relative to non‐farmed areas, which is consistent with there being an impact of salmon farming on wild salmon. 2. The farmed area represents a relatively small (5‐19) percentage of all the Scotland rod catch.’
This statement raises two key points:
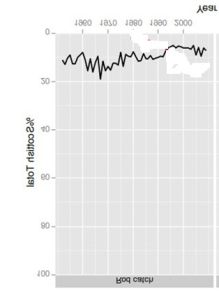
The first is that the graph can be flipped so that the east coast catches are below the line and the west coast catches are above it. It now appears that east coast catches have increased, which the Scottish Government rod catch data confirms they did (because more fish were finding their way into the rivers). This would squeeze the percentage of fish caught from west coast rivers making them appear to be in decline.
Secondly, the scientists have already said that:
‘Rod catches give an indication of the number of salmon or sea trout present in the river and therefore provide a measure of the strength of the populations. They do not, however, give a good measure of changes in factors which are affecting at‐sea survival, potentially including the impact of aquaculture. It is well acknowledged that the relationship between rod catches and actual number of fish in the river stock depends on factors that vary from year to year, such as water flow and fishing effort. However, by examining trends over a sequence of years, much of the short‐term variation in such factors can be smoothed out.’
I can only wonder how these scientists can conclude:
From roughly 1990 the farmed areas decline relative to non‐farmed areas, which is consistent with there being an impact of salmon farming on wild salmon
They go on to say:
‘It is very important to note that analyses of fishery catches such as these cannot be used to prove whether or not fish farming has an impact on wild fish as there are many other factors that may cause changes in fish populations and may differ between the regions of coast that were considered. For example, catches of sea trout have declined over recent decades on both farmed and non‐farmed areas in Scotland and it is plausible that different factors are responsible in the two regions.’
What is being said is that I cannot use 55 years of catch data to show that salmon farming is not the cause of wild salmon declines but Marine Directorate scientists can use less than ten years of catch data to suggest that this short-term decline is consistent with their being an impact on wild fish from salmon farming. It seems only that catch data can be used if it is to prove salmon farming does have an impact on wild fish. What is consistent is Marine Directorate science’s favouritism to the angling sector, of which there is many examples.
At the beginning of this commentary, I mentioned that I had recently interacted with Marine Directorate scientists who were quick to tell me again that catch data cannot be used to infer whether salmon farming has an impact on wild fish or not although their first question to me was what data was I using? Strangely, they seemed unable to recognise the data they have collected since 1952. The problem for them is that they have always displayed the various catch components separately. Thus, they produce a graph for rod catch, a separate graph for coastal netting and another graph for net and coble netting. They never combine the data so clearly fail to recognise it even though they must have looked at the various graphs for their 2016 evaluation. Their problem is that they do not consider net data to have any value. When it was explained to them that the dataset used was rod and net data combined, the immediate response was that ‘you can’t use net data’. When asked why, they replied that nets are interceptory fisheries, which means that for example, there is no guarantee that any fish caught by nets off the mouth of the river Tay were destined to enter the Tay. They could have been heading to any river. This might be relevant if examining the total catch for the river Tay but as the analysis combined all catches into one figure, it makes no difference if the fish were headed to the Tay or the Tweed. It is the combined number that matters. However, it is possible that some fish caught might have been destined to end up in an English river but the catches from these rivers are relatively small and there is no reason to believe that a few might have been caught every year so potentially cancelling out any effect from these few rivers.
In my opinion, the Marine Directorate scientists have a fixed view that salmon framing has an impact on wild fish and any attempt to prove otherwise is dismissed out of hand. I would argue that their view that catch data cannot be used is not based on any substantiated evidence simply on the preconception that salmon farming must be to blame. However, this is typical of the whole narrative about salmon farming, so this is nothing different.
Finally, Marine Directorate scientists told me that they had moved on from catch data – were they ever on it? – and now rely on their models for evidence. Of course, what they fail to mention is that the models are built on various assumptions with the main assumption being that salmon farming is damaging to wild fish. As far as the Marine Directorate scientists are concerned the case is closed.