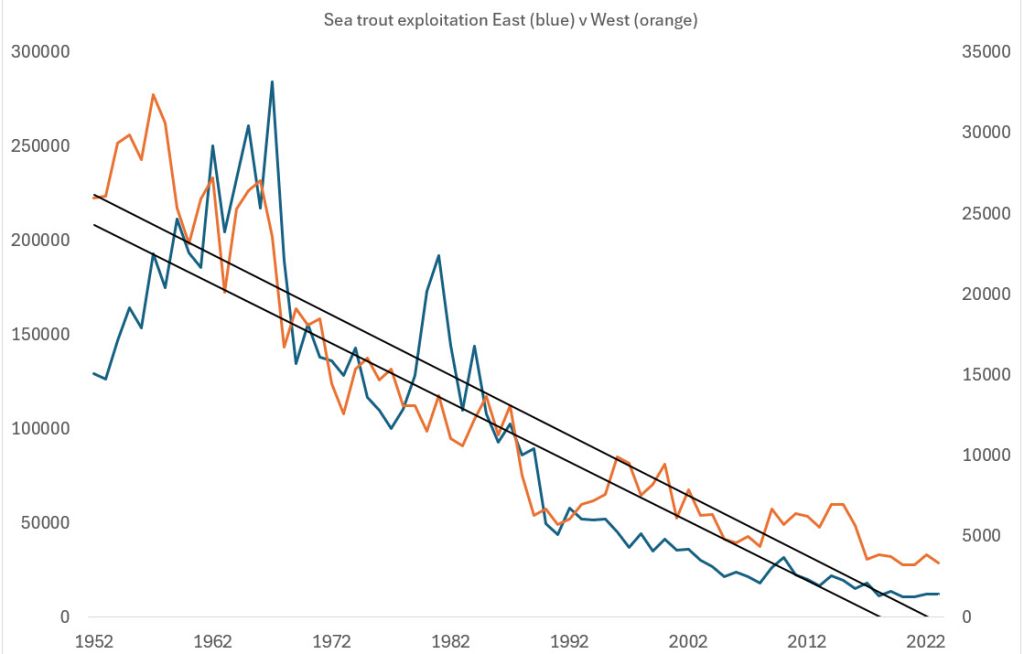
Sea trout model: I’d like to begin this commentary by sharing the following graph:

If this looks familiar it is because it shows the rate of decline of fish caught from rivers along the west coast compared to fish caught from east coast rivers. However, this is not the usual graph of salmon catches I have previously posted but one for sea trout catches from the same rivers along both Scottish coasts. This graph covers a longer period from 1952, which was when records first began.
As for salmon catches, the rate of decline for sea trout looks remarkably similar for both east and west coasts. A paper published a year ago by Bolstad and others states that the Norwegian Scientific Advisory Committee for Atlantic Salmon (VRL) has said that sea lice are the anthropogenic effect with the largest adverse impact on sea trout status, yet if sea lice associated with salmon farms has cause the decline in the area where salmon farms operate, which is along Scotland’s west coast, then what is causing a similar rate of decline for sea trout along the east coast, where there are no salmon farms.
As with salmon, no-one from the wild fish or scientific community has put forward any explanation as to why the rate of decline of sea trout catches is so similar for both coasts. What the graph does suggest is that sea trout are in decline across all of Scotland equally, in which case, sea lice and salmon farming cannot be to blame. Could it be that VRL have got it wrong?
Sea trout are in the news because as Intrafish reported the Minister of Fisheries has said the Norwegian Institute for Nature Research have developed a new model of the impacts of sea lice on sea trout which could be used as part of the regulatory process for salmon farming. I have managed to obtain a copy of the NINA report in which they detail the development of their model. It is no secret that I am not a great fan of the use of models simply because I do not believe that they are a true reflection of what happens in the real world. For example, the NINA report states:
“The model is based, among other things, on HI’s (IMR) lice distribution model. To connect this to a lice infestation in sea trout, we must model where and when the sea trout is in the sea.”
Whilst it may be of interest to NINA to know where the sea trout are located, which I don’t think is something that is predictable, of much more interest is knowing where the infective lice larvae that are supposed to infect the sea trout are located and in what numbers. Whilst IMR know where the lice are according to their model, they are unable to say where they are in real life. As I have written previously, researchers have been seeking the infective lice stages in the water since 1994 and so far, no-one has manged to find any except in extremely low numbers that bear no relation to what the model says. The reality is that if infective sea lice larvae are not present in the waters of Norwegian fjords in the numbers predicted by the models or at all, then they cannot represent a risk to wild sea trout or salmon.
In a paper attached to the NINA report, the authors, who form some of the research team, have written that urgent action is needed to mitigate the effects of Atlantic salmon aquaculture on sea trout. They say that VRL have estimated that in 2024, sea trout stocks are in a poor or very poor condition in 38.5% out of 1251 water courses. Yet, VRL do not provide conclusive evidence that sea lice are the reason why these sea trout stocks are in a poor state other than conjecture. In addition, VRL have not seen to have considered any potential impacts that are not man-made as a reason for the poor status.
Whilst Norwegian researchers say Scotland Is not the same as Norway in terms of wild fish stocks – which is their excuse for not having to address any evidence that doesn’t fit into their narrative, the reality is that wild fish stocks follow many similar patterns in both Norway and Scotland. The most significant is the decline in salmon returning to their home rivers to spawn as determined by ICES.
.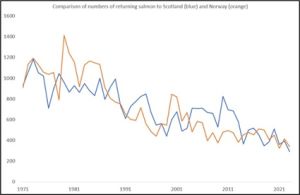
I would suggest that there is significant similarity between the rate of decline of fish returning to Scotland and to Norway, but this similarity is not considered because Norwegian researchers aren’t prepared to discuss real evidence when their models tell them differently.
However, this commentary is not about salmon but rather about sea trout. In Scotland the narrative about sea trout is all about the collapse of the Loch Maree sea trout fishery in 1988, which is blamed on the arrival of a new farm in Loch Ewe in November 1987. According to Butler and Walker (2006), this newly stocked farm was responsible for the collapse of sea trout catch from 600 fish in 1987 to 200 in 1988 and 100 in 1989 although the official statistics put the numbers as 1710 in 1987, 1081 in 1988 and 612 in 1989. Although in a state of collapse, the 1992 catch rose to 1108 fish whereas Butler & Walker recorded an increased catch in 1990 of 300 fish. The difference is because they looked just at the Loch Maree hotel fishery whilst the catch statistics are for the loch system.
However, Loch Maree was already an outlier in 1987 as sea trout catches along the west coast had already collapsed before the arrival of salmon farming. In fact, sea trout catches had been in decline for thirty years by the time salmon farm production reached just 1,000 tonnes in 1982. The wild fish and scientific communities never considered the possibility that whatever caused the decline in sea trout before salmon farming arrived on the east coast might still be responsible for the declines after the arrival of salmon farming.
Whilst the wild fish sector continues to focus on Loch Maree, the most spectacular collapse of sea trout occurred in the Clayburn fisheries district of the Outer Hebrides.
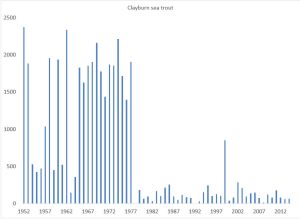
I have researched this collapse and can find no record of an explanation nor outcry from the wild fish sector. It is if it never happened. Perhaps this is because salmon farming would not reach the locality for at least four more years after the collapse.
At the beginning of this commentary, I posted the graph comparing sea trout catches from two different coastlines, one with salmon farming and one without. I just wonder how much evidence is required before anyone starts to question whether the model predictions are an estimated prediction.
Whilst all the data for the graphs above originate from ICES and the Sottish government, there is other data highlighted by NINA that has clearly not been recognised by those working on the NINA model.
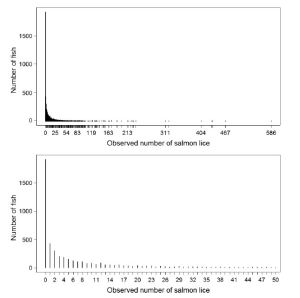
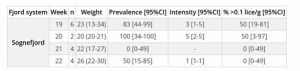
In 2015, four scientists from NINA published a paper with scientists from the Veterinary Institute and the Institute of Marine Research. This is the paper by Helland et al. concerning statistical and ecological challenges of monitoring sea lice infestations in wild fish stocks. The authors undertook an analysis of 4610 wild sea trout sampled between 2004 and 2010 from 41 sites as part of the Norwegian sea lice monitoring programme. The spread of sea lice amongst these sampled sea trout is shown in their graph.
The purpose of their paper was to investigate the best statistical method to express the distribution of sea lice amongst their hosts. They write:
‘Due to the 0-inflated distribution of salmon lice data, abundance (mean or median based on all individuals) is not a suitable way of describing the variation at the population level. Further, intensity and prevalence are not suitable measures for our modelling approach because they either exclude individuals without any lice (intensity, mean or median based on infected individuals only) or do not take into account the variation in extent of infestation (prevalence, the proportion of infected hosts).’
Whilst this NINA paper suggests that using abundance, prevalence and intensity should not be used to describe the distribution of sea lice, IMR choose to use these descriptions in their reports such as that titled ‘Sea lice infestation in wild salmon in the spring of 2025’ as illustrated following.
However, the most important point of the Helland graph is that it shows that half the fish sampled carried no lice and most of the rest carried very low numbers. If the majority of fish are lice free, they cannot be at risk of harm or mortality, Analyses of other Norwegian data as well as that from Canada and Scotland show the same distribution, which is not surprising given that this is how all parasites are distributed. The only examples I have seen that do not fit this pattern are the IMR NALO lice data which I believe suffers from poor sampling.
The authors highlight that growth is also important and their model includes indicators from Ostrovsky’s (1995) model so another model on a model. They say that:
‘Growth in the sea will be important to model, since one of the main effects of lice on sea trout fitness is through loss of growth. Growth is also important in the infestation model, since it affects the lice infestation (a large fish is exposed to more lice than a small fish, due to its larger surface area, among other things) and because the degree of infestation is initially measured in lice per gram of fish weight.’
This raises a couple of issues. Firstly, with sea lice larvae concentrations in the fjords of less than one louse larvae per cubic metre, it would seem to make no difference whether the fish is small or large.
Secondly, most sampled fish are killed so there is no possibility of recapture. There is one example of recapture published by the Wester Ross Fisheries Trust from 2012. On the 5th of June a sea trout of 375mm and weighing 532g was caught infested with 120 chalimus lice. The fish was release but recaptured on 17th July and was 390 mm long (+15mm) and 640g in weight (+108g) with an infestation of only 10 lice (-110).
It would appear that sea trout (and presumably salmon) can lose their sea lice infestation too.
It seems that there is now so much reliance on models upon models that there is very little relation to what actually happens in real life. It’s not surprising that the established scientific community are so reluctant to talk because they are speaking in a totally different world to those who prefer to look at real life evidence. This new model will do nothing to protect wild sea trout but will do everything to harm the salmon farming industry.