Not one salmon: Trond Hatland, representing the 25 salmon farming companies who have taken the Norwegian Government to court to challenge the Traffic Light system for regulating salmon production, told the court that ‘There is not one salmon that can be presented here in court that has died of sea lice’. He is right. The Traffic Light system relies on theoretical mathematical models to estimate mortality of wild fish due to the impact of salmon farming.
I have written previously that Vitenskapelig råd for lakseforvaltning (VRL) have produced a graph showing the threats to wild salmon.
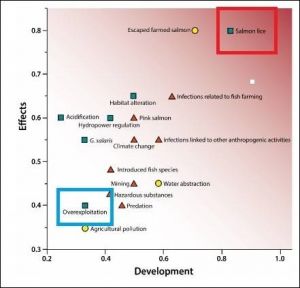
Salmon lice (red box) were calculated to lead to the deaths of an estimated 39,000 migratory smolts last year. Not one single dead fish has been produced in evidence. By comparison, 136,000 wild salmon were caught and killed on their return to Norwegian rivers to breed. Every death has been officially recorded but VRL do not consider the loss of these fish as a threat to the viability of Norwegian salmon stocks (Blue box). As can be seen from the graph, sea lice are considered the biggest threat overall to wild salmon based on their mathematical modelling.
In fact, the greatest threats to Norwegian salmon, according to VRL, all originate from salmon farms. This is not surprising since the evidence shows that declining salmon stocks are correlated to increased farm production.
Prompted by my recent references to correlations, Aquablogg.no has kindly sent me a graph showing the correlation between wild and farmed salmon in Norway.
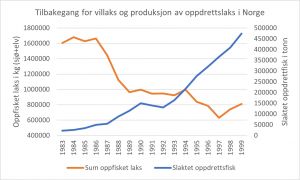
The evidence is so clear; as farmed production increased, wild salmon numbers have declined. This is the basis which has led VRL and others to build their models showing that sea lice kill migrating salmon.
Yet, could it be that whilst Norwegian scientists focus their attention on building mathematical models to predict mortality that decides whether the Norwegian production zones are to be classified as green, yellow, or red, that wild salmon declines may be due to something completely different.
VRL have identified seventeen different threats to wild salmon including salmon farming, habitat loss, pollution, water abstraction, Pink salmon, and acidification. Could it be that scientists are so blinkered by their models that there could be other impacts that they have not even considered.
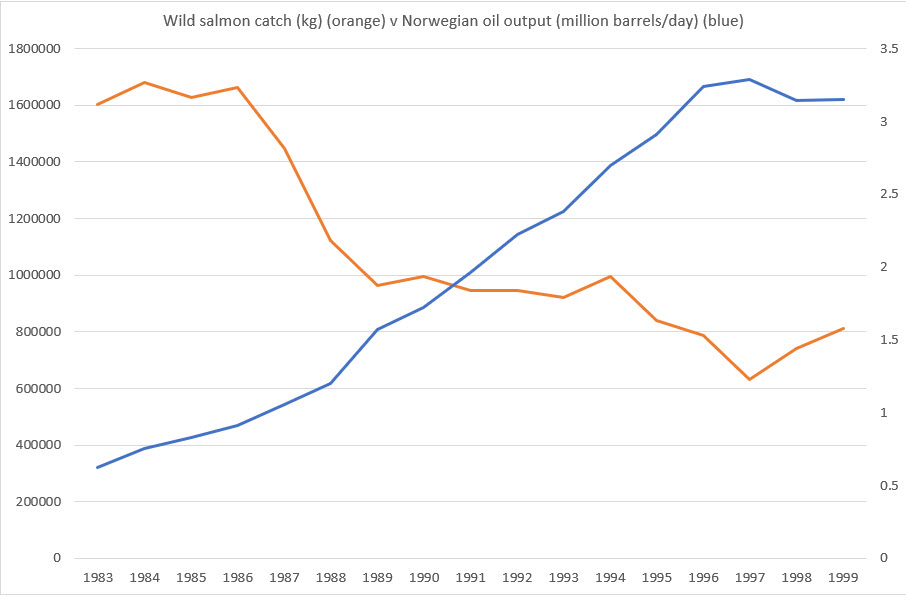
I have produced the following graph. It looks extremely similar to the previous graph correlating the decline of wild salmon to salmon farm production, yet this graph has nothing to do with salmon farming nor any of the other threats that VRL have listed.
This graph correlates the decline of wild fish to Norwegian oil production. It is just as convincing as the correlation between wild fish declines and increased farm production, and there is also a good explanation as to why wild salmon are affected. I have previously written about the damaging impacts of the continuous seismic surveying, which continues even today.
These seismic surveys involve towing an array of seismic airguns behind a boat following a grid pattern. The array of multiple airguns generates a sound many times greater than using a single airgun and has the potential to cause injury, hearing loss, behavioural changes and masking in fishes which prevents fish hearing sounds that are important to their behaviour. Several studies have been instigated to measure the impacts of airguns on marine life, but nothing appears to have been directed to investigating the effects on migrating salmon. Given that the oil and salmon industries are important to Norway, it is a puzzle why the Institute of Marine Research and other research institutions do not seem to have considered this issue.
Perhaps, lawyer Trond Hatland should be asking the scientists from the Expert Salmon Group or IMR to explain why they have stubbornly focused on mathematical models when there are such blatant gaps in the knowledge about the fate of migratory wild salmon. What this illustrates is that these Traffic Lights should be switched off until it is clearly proven that it is salmon farming that has an impact on wild salmon.
Correlative correlation: Last October, Polly Burns, Marine Scotland funded FMS Interactions Manager submitted an objection to Argyll and Bute Council about a planning application for a salmon farm in Kilbrannan Sound. The objection runs to seventeen pages and starts by stating that:
“Scotland’s wild salmon and sea trout are at crisis point with many populations, particularly on the West Coast within the ‘Aquaculture zone’, below conservation limits. Whilst wild salmon face a range of pressures, specific pressures from the aquaculture industry include impacts from escapes and sea lice.”
Page six focusses on sea lice and begins by stating:
“Marine Scotland Science have summarised the information relating to impacts of salmon lice from fish farms on wild Scottish sea trout and salmon. This summary discusses the effect of salmon lice on wild salmon at the population level. The studies quoted in this summary show that a small increase in mortality of wild fish, due to sea lice arising from fish farms, may be the difference between a river meeting its conservation limit or not,”
It is Polly’s reference to Marine Scotland Science’s ‘Summary of the Science’ that is of interest. It is referenced in most planning applications and is treated as being a definitive statement on sea lice impacts on wild salmon populations. (https://www.gov.scot/publications/summary-of-information-relating-to-impacts-of-salmon-lice-from-fish-farms-on-wild-scottish-sea-trout-and-salmon/ ).
Regular readers of reLAKSation may remember that I have discussed this summary more than once over recent years. I am revisiting it now to look at it with regard to correlative evidence continuing the theme from the last two weeks.
In the section looking at the effect of salmon lice on wild salmon at population level, the summary states:
“Declines in catches of wild salmon have been steeper on the Scottish west coast that elsewhere in Scotland and Norway (Vøllestad et.al 2009) although the authors stressed that this did not prove a causative link with aquaculture.”
The text of the Vøllestad paper includes just three appearances of the word ‘aquaculture’ and two of the word ‘farm’. All appear in one of the final paragraphs of the discussion. This paper is not about the impacts of salmon farms on wild fish at all. It simply makes an inference in the discussion. The paper says with regard to Scotland that the Atlantic sector rivers (west coast) drain into an area with a high density of Marine salmon farms. From this, they infer about declining catches that:
“Although other explanations are possible, some of the differences between the Atlantic sector and the other Scottish sectors might be due to local effects of intensive aquaculture on affected rivers.”
Simply put, the authors have implied that salmon farms are responsible for declines of salmon on the west coast even though they do not have a shred of evidence to support their claims.
As mentioned, the paper is about identification of spatial correlation of the rod catch between neighbouring rivers, it is not about the impacts of salmon farms. In fact, the paper is inherently flawed if such conclusions are to be drawn for their work. This is because the authors selected rivers for analysis based on their distance from each other. This meant data from other rivers such as the Lochy, Broom and Gruinard and many other rivers were not included and therefore disregarded. In fact, 63% of the rivers in the North Sea zone were included in the research; 64% of rivers in the Irish Sea but just 32% of rivers in the Atlantic zone. Its hardly surprising that the data from the west coast (Atlantic) zone showed a poorer response than the other two sectors.

This is their graph of catch data. The black line is the North Sea: the green dots the Irish Sea and the red dashes the Atlantic coast. This graph has been subject to statistical analysis so is different to the graphs of catch data that I produce. The authors infer that the dip of Atlantic catches is due to the presence of salmon farms although the MSS’s summary of the science does state that this work does not prove a causative link.
The question is that if the there is no evidence that salmon farms, and sea lice from them, ae not shown to have caused the decline, then why is this paper even included in the summary of science posted on the Scottish Government webpage.
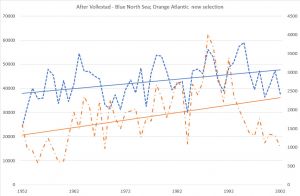
As mentioned, my usual method of displaying catch data is in graphical form derived from the raw data. As the Vøllestad paper lists the rivers they selected in the supplemental information, I have redrawn their graph. The blue line represents the North Sea sector, the Irish Sea by the grey line and the Atlantic coast by the orange. What is clear is that whilst MSS’s summary of science states that ‘declines in catches of wild salmon have been steeper on the Scottish west coast (Atlantic) than elsewhere in Scotland’ only the Atlantic coast is in decline. Catches from the North and Irish Sea areas have actually increased over the period studied. I am not sure what data MSS used to decide that catches of wild salmon are in decline outside the west coast because MSS’s own catch data shows that catches outside the west coast were not in decline. Maybe they should pay more attention to their own data rather than the work of Vøllestad and others.
Part of the problem here is that as I have pointed out, Vøllestad selected rivers to analyse rather than use all of them. To complicate matters, their Atlantic sector includes rivers from the north coast which are outside the aquaculture zone. Thus, Vøllestad was incorrect to say that rivers in the Atlantic section might be affected by the impact of intensive aquaculture because rivers such as the Thurso and the Halladale are some distance from any salmon farming activity.

To demonstrate that Marine Scotland Science have relied too heavily on the simple correlation that links the decline of wild salmon catches with the increase of salmon farming, I too have selected 20 rivers (32%) from the Atlantic coast all of which are located within the aquaculture zone. I have compared the catches of these rivers with those selected by Vøllestad from the North Sea sector. The two series are shown in the following graph
Rather surprisingly, both series show a positive trend with catches increasing in both. Even more surprisingly, catches from rivers within the west coast aquaculture zone (Atlantic) have increased at a greater rate then those on the North Sea coast. For the North Sea sector, Vøllestad has included the great rivers of the Tweed, Tay, Dee, Spey with catches that outweigh most of the catches from the west coast rivers added together.
Clearly, Vøllestad got it wrong.
I remain puzzled as to why this paper is used by MSS to argue that sea lice from salmon farms have a negative impact on wild salmon stocks. Perhaps, one explanation is that three of the authors worked at the Freshwater Fisheries Laboratory and that one, Dr John Armstrong, is the laboratory’s lead scientist.
What is more interesting is that John co-authored a Marine Scotland Science report in 2016. This is titled ‘Using catch data to examine the potential impact of aquaculture on salmon and sea trout’. It is authored by Stuart Middlemas, Gordon Smith and John Armstrong. https://www.gov.scot/publications/using-catch-data-to-examine-the-potential-impact-of-aquaculture-on-salmon-and-sea-trout/
In the summary, Middlemas, Smith and Armstrong state:
“Broad scale comparisons of catch data (East/West, farming/non-farming) is not ideally suited to providing evidence of any impact of fish farming.”
Yet, Marine Scotland Science have done exactly that.
In this report, the authors include this graph (This is cropped because the area from 20-100% contains no information). The black line is the catch from rivers within the Aquaculture Zone and the red line is farmed salmon production.
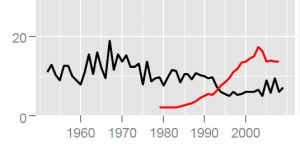
They then state that:
‘From roughly 1990, the farmed areas decline relative to non-farmed areas, which is consistent with there being an impact on salmon farming on wild salmon.
If this is not a broad scale comparison of catch data from west coast farming areas to east coast non- farming areas, then I don’t know what is. The reality is that there appears to be a general acceptance in Marine Scotland Science that wild salmon declines correlate with increased farm production, even though there is still no hard evidence to prove it.
Equally, this is exactly what Vøllestad did and MSS cite that paper as indicating an impact on wild salmon populations in their summary of the science. They also cite the paper by Ford & Meyer (2008) stating that:
Ford & Myers (2008) compared indices of salmon abundance on the east and west coasts of Scotland together with farm production data. They found a reduction in catches and counts of salmon on the west coast correlating with increased production of farmed salmon.
I can only repeat what John Armstrong and his colleagues said in their 2016 report – Broad scale comparisons of catch data is not ideally suited to providing evidence of any impact of fish farming but then in the same summary they also say: ‘Analysis of the catch statistics is consistent with an impact of salmon farming on wild salmon but does not prove a causative link.’
What I take from all of this is that correlations between wild salmon declines and farm salmon production cannot be used to demonstrate an impact or a causative link but if the correlations are repeated enough times, then an impact can be implied anyway.
Is this really science or simply mistaken and blinkered beliefs based on correlations that prove nothing. Of more concern is that the whole of the Scottish Government’s sea lice policy appears to be based on an unproven correlation.
Very narrow: I understand that Marine Scotland Science’s 2016 report about the use of catch data was written in response to my own work on catch statistics. Certainly, MSS didn’t write this report in response to the use of catch data to show an impact on the west coast by the Rivers & Fisheries Trust of Scotland in 2011 and subsequently by Salmon & Trout Conservation but then they weren’t questioning the impacts of sea lice from salmon farms on wild salmon stocks as I do.
Whilst Marine Scotland Science assumed that I had also compared east and west coast catches, my focus was at a very local level and on the impact of salmon farming in just one loch. I tried to discuss this with MSS, but they didn’t respond.
My interest was prompted by this graph from Butler and Walker (2006).
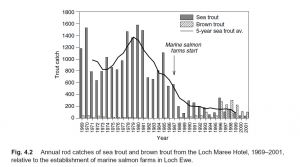
Their paper implies that the loch Maree Sea Trout fishery collapsed in 1988 as a result of the arrival of a salmon farm in Loch Ewe. Their data comes from catches of sea trout at the Loch Maree Hotel. I reproduced the graph using MSS data.
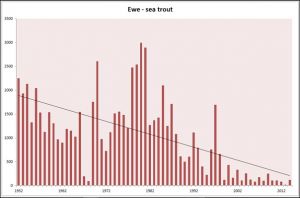
Use of all the Ewe fishery district data does not make the association with salmon farming appear so clear. However, what really caught my eye was when I produced the graph for salmon and grilse catches.
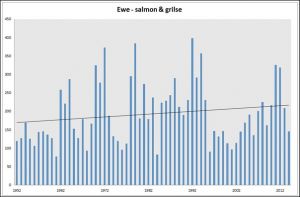
Salmon & grilse catches have increased despite the presence of salmon farming. In fact, since Scottish rivers have been classified for conservation, the River Ewe has been a grade one river, comparable to the Tweed, Tay and Spey? Trout & Salmon magazine even reported arch salmon farming critic Andrew Graham Stewart had spent a week fishing the river. How can this be? I am still waiting for someone to provide me with an explanation.