Validity: We came across an interesting exchange on Twitter this week. Someone named Salmon Ranching posted our graph of sea trout declines pointing out to their followers that after nearly seven decades of data, it is apparent that similar declining trends have occurred across all of Scotland, therefore questioning the claims that salmon farming is to blame.
In response, Salmon Research replied that with regard to catch statistics, there are so many variables that it is virtually pointless to draw any conclusion, as those at Callander McDowell well know. There is an extinction event in progress in the west coast aquaculture zone and the salmon farming industry is enabling it.
Salmon Research’s comments raise a number of issues, not least the fact that he hides behind a Twitter name and snipes away behind the safety of a computer screen. We, at Callander McDowell would be more then happy to meet Salmon Research and discuss the issues face to face but like most critics of the salmon farming industry there is a total unwillingness to engage. Perhaps, this is because there is a risk that we will undermine their claims and correct their misconceptions. Perhaps Salmon Research would like to supply some alternative evidence to support his claims that wild fish from the west coast are heading towards extinction.
Criticism of catch data is something we regularly encounter. Use of catch data is certainly not without issue and this is something we have often highlighted. For example, last year was an extremely dry year resulting in fewer fish making their way up rivers across Scotland. Consequently, fewer fish were caught and this led to dire warnings in the media of a catastrophe of wild salmon. This year, with much more rain, we understand that catches are much improved, especially on the east coast. Over in the west, we have previously argued that a dip in catches which critics attribute to the influence of salmon farms had more to do with the lack of anglers and a reduced fishing effort. This was because the angling organisations had claimed that there were no fish left in the west and hence anglers opted to go and spend their week’s fishing where they thought they had a chance of catching a fish.
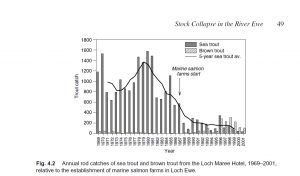
We would argue that by examining all the data since 1952, when records first began, many of the year to year variations are minimised leaving a reasonably accurate overall trend. By comparison, critics of the industry often condense the data they examine into a much shorter time period. For example, Butler & Walker, who highlighted the collapse of the Loch Ewe sea trout fishery ran data from 1969, ignoring the seventeen years of declining catches that the data records. They also used the data just from the hotel fishery rather than the whole catchment.
Our use of graphs of catch data is not unique as they are widely used in the wild fish sector. Our attention was drawn to the use of catch data through the publication of such graphs in the Association of Salmon Fishery Board’s (now Fisheries Management Scotland) Annual Review. This includes a roundup of the status of all the major salmon fishing rivers in Scotland. What prompted our interest was the inclusion of catch data from the River Ewe system which included not only the data for sea trout but also for salmon. Everything we had previously heard concerned the negative impact of salmon farming on stocks of sea trout in the Ewe System. What was also apparent was that half the data for salmon was missing. This sparked our interest and led to an extensive examination of the catch data for all of Scotland.

Catch data is collected by Marine Scotland Science who every year produce a summary of catches for salmon and sea trout. In 2013 and 2014, they published a more extensive status report looking at the data in more detail. The 2013 report (03/14) discusses the rod catch:
Rod catches have traditionally been used to assess the status of salmon in Scotland. An underlying assumption in the use of these data is that there is no consistent change in the percentage of available salmon captured by the fisheries (exploitation rate) over time or among rivers. Exploitation rate may be influenced by a number of factors including river flow, fishing effort and fishing efficiency. This limitation should be considered when interpreting rod catch data. However, rod catches are the most comprehensive potential indicator of stock status in terms of temporal and geographical coverage, and in many areas may be the only information available.
However, when it comes to the River Ewe, we are much more interested in sea trout catches. The status report states:
As with salmon, rod catches have traditionally been used to assess the status of sea trout in Scotland. In the absence of fish count and fish trap data, the following assessment is based on rod catch alone. Further, as we have no information on run-timing in the structuring of sea trout stocks, analyses are restricted to aggregation across the year. The rod catch tool has been applied to the last 20 years of sea trout catches to determine recent trends in catches.
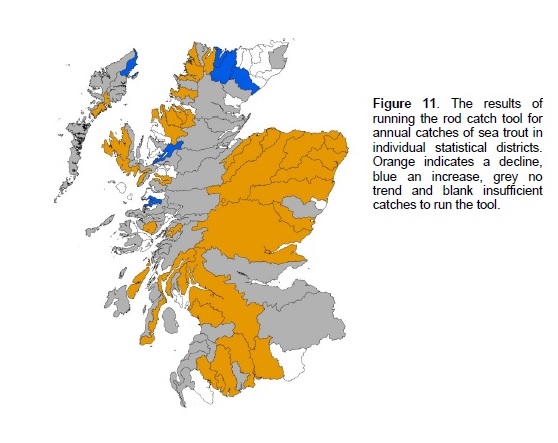
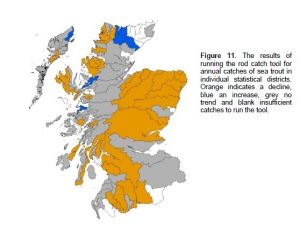
The status report shows an overall downward trend for sea trout catches but it also includes a breakdown of the changes observed in most of the fishery districts. These are shown on the following map:

It can be seen that the trends vary between fishery districts. What is apparent is that whilst some west coast districts are in decline, other have shown an increase. By comparison, some of the biggest rivers in Scotland have also shown a decline in their sea trout catches.
Whilst, it seems that it is acceptable for Marine Scotland Science to investigate the trends in individual fishery districts, Salmon Research criticises our study of the same data in exactly the same way, except, unlike MSS, we have covered every fishery district since 1952 for both salmon and sea trout catches.
Of course, whilst we can determine that some catch trends show a decline, we cannot say what has caused those declines. In 2016, Marine Scotland Science published a document outlining that it is impossible to determine whether changes to catches are due to the influence of salmon farming. The document – ‘Using catch data to examine the potential impact of aquaculture on wild salmon and sea trout’ – was put together in direct response to our investigations. MSS concluded that salmon farming is a range of factors which may affect the survival of wild salmon and sea trout but at present it is not possible to determine the influence of these different factors. MSS also say that that analysis of catch statistics is consistent with an impact from farming on wild salmon but does not prove a causative link.
We, at Callander McDowell, have previously written extensively about this document and its conclusions. Because of the way that MSS compiled this data (catches from Aquaculture Zone as a percentage of the total) it could equally be argued that the decline on the west coast was due to increased catches on the east coast i.e. as one coast increases the other coast decreases and vice versa, which rather nullifies their argument.
The Rivers & Fisheries Trusts of Scotland (RAFTS) also used catch data to show an impact from salmon farming. They took catch data for salmon from 1970 and then plotted the annual rate of change for catches from east and west coasts. At the time (2011) they said that east coast catches were up by 24%, whilst those on the west coast had declined by 42%.
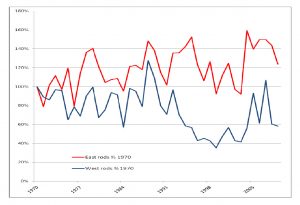
We would argue that this interpretation was flawed. This is because they assumed that 1970 was 100% and thus stable which was not the case at all. In addition, west coast catches account for just 10% of total catch whilst the east coast is around 90%. Thus, in the west, even small changes are magnified by the use of percentages changes. This is why we would argue that the actual number of fish caught gives a much clearer indication of the trends and whilst the catch data cannot provide an answer as to why catches have declined, they can raise some interesting questions.
We recently posted our graph comparing the decline of catches from the aquaculture zone and from the east coast. The overall trends for both sets of data show remarkable similarity.
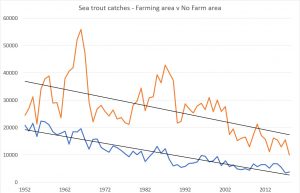
This similarity could suggest that the decline of catches from both coasts might be for the same reason. The west coast aquaculture zone doesn’t appear to show any change of trend from the 1980s onwards when salmon farming became established, for example, it didn’t speed up. This would suggest that the impact from salmon farming is minimal. In addition, as we have regularly pointed out, the declining trend began from the 1960s if not before, which is long before salmon farming appeared in Scotland. These trends do not suggest that there was anything different on one coast from the other therefore as there is no salmon farming in the east, it is unlikely that salmon farms are the cause of problems in the aquaculture zone.
We heard that one member of the audience at a recent showing of the film ‘Artifishal’ asked the panel about these long-term trends. Andrew Graham Stewart of Salmon & Trout Conservation dismissed the question saying that there is only one advocate of this view. i.e. us, at Callander McDowell. We would certainly be very interested in hearing Mr Graham Stewart’s view on these trends but unfortunately, whilst he is quick to dismiss our view, he will not do so to our face. We have repeatedly tried to speak to Mr Graham Stewart to discuss the impact of salmon farms, but he never responds. In fact, there are others from the wild fish sector who are equally reluctant to tell us to our face why they think we are wrong, if indeed we are wrong.
We again issue a challenge to all the wild fish sector to tell us why these long-term trends do not support the view that aquaculture isn’t to blame for the disappearance of wild caught fish and especially, sea trout from west coast fisheries.