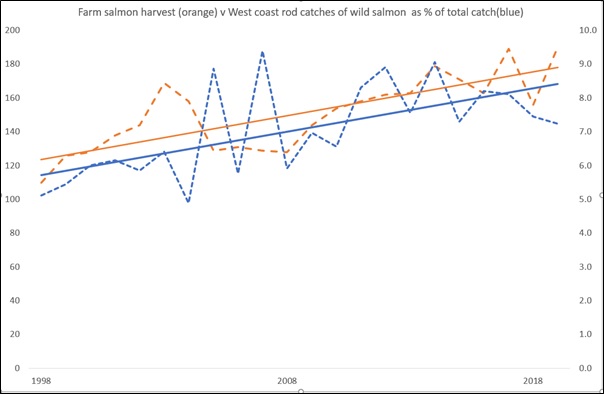
It is good to share: I would like to share a graph and a video with you. The graph finally explodes the lie that salmon farming is negatively impacting on wild salmon catches on Scotland’s west coast.
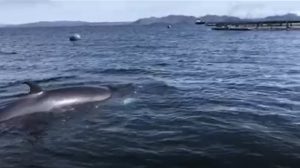
Before I explain the graph, I would like to share a video which was filmed this week by Mowi Scotland and then posted on Twitter. This short video can be viewed at:
https://www.youtube.com/watch?v=AcskVaawC8g&feature=youtu.be
Thanks to Mowi Scotland for sharing
The video is of a minke whale swimming past one of Mowi’s salmon farms. Mowi also shared a video of dolphins riding the bow wave of their workboat. According to the critics, salmon farming has driven wildlife away from the west coast. Somewhat surprisingly, no-one told the whales and dolphins seen this week.
The graph also disapproves the claims made by the angling fraternity that salmon farming is to blame for the decline of wild salmon from rivers in the west coast aquaculture zone. Since I carried out a full analysis of the catch statistics in 2015 as a prelude to my book – Loch Maree’s Missing Sea Trout (still available on Amazon) I have not examined the full data set again only the parts that have been of immediate interest.
Last week, the Scottish Government published the rod catch data for 2019 prompting me to revisit the statistics as a whole. Unfortunately, this is no longer possible as Marine Scotland Science have changed the way the statistics are presented by amalgamating the catches from more than one fishery district. This means that long term trends for many fishery districts have been invalidated. I will return later to that issue and instead focus on the above graph.
The blue line is the aquaculture zone rod catch expressed as a percentage of the total Scottish catch. What is clearly apparent is that since the late 1990s, catches have increased and have continued to increase despite the growth of farmed salmon production. This is shown by the orange line. In addition, the trend lines for the two sets of data show remarkable similarity.
I accept that the critics will aim to undermine the evidence provided by this graph so I will endeavour to explain how it was calculated. However, I doubt that even this will satisfy some critics. One common comment I hear is that the catch data is unreliable and thus cannot be used to make any valid assessments. Willie Shearer, who worked for many years connected to the Freshwater Fisheries Laboratory, wrote in his 1992 book ‘Atlantic Salmon’ that catches by rod and line fisheries are often under reported.
Clearly, if rod catches were unreliable in 1992, then they are probably still unreliable. This is a matter for the wild fish sector to address but with the lack of any other data, the catch statistics are all that is available to work with. If my analysis is to be dismissed by the wild fish sector, then they need to come up with a better narrative based on more accurate data. This is their problem not mine.
To understand how the data shows that west coast rod catches of wild salmon in the Aquaculture Zone have increased over the last twenty years, it is necessary to look at a graph taken from a Marine Science Scotland publication entitled ‘Using Catch Data to Examine the Potential Impact of Aquaculture on Salmon and Sea Trout’ authored by Stuart Middlemas, Gordon Smith and head of the Fisheries Laboratory at Pitlochry, John Armstrong. In the report, the authors state that ‘Examining the proportion of the total Scottish rod catch taken in the farming and non-farming areas highlights the differences in trends between these area’. The graphical analysis is shown in the following graph. This is not the easiest graph to understand but the furthest point on the left of the black line represents the salmon catch in 1952. The black line is at a value of 15.4% of Scottish total. This means that if the total Scottish catch was 1000 salmon, then 154 of them were caught from rivers in the Aquaculture Zone and 846 were caught from other non-farming areas.
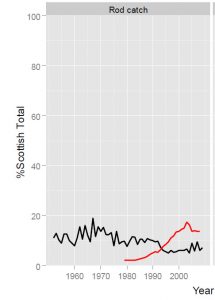
The lowest point on the black line occurs during the early 1990s and is 5% meaning that 50 fish were caught from the west coast and 950 from elsewhere.
The authors have included a red line on the graph which shows the increase in farmed salmon production and because the lines across near the low point of 5%, they have concluded that ‘ From roughly 1990 the farmed areas decline relative to non-farmed areas which is being consistent with there being an impact of salmon farming on wild salmon’.
The problem with this conclusion is that the dip in 1990 that is apparent on the graph could be due to other factors than salmon. The two most obvious are that catches may have declined in the early 1990s due to reduced fishing effort or that salmon catches increased in the other areas, reducing the percentage allocated to the west.
What is more interesting is that whilst farm production (red line) increased, the percentage catch did not decline any further than occurred in 1990. In fact, a closer look at the black line suggests that the percentage catch has increased. The MSS report only considered the data until 2009 (even though the report was not published until 2016)
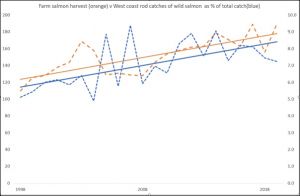
Using the data from 1998 (i.e. for the last twenty years), I have recalculated the west coast percentage catch in exactly the same way as Marine Scotland Science. The pattern is the same as that in the MSS report, but I have extended the data to 2019, although the 2019 figure is not exact due to the restrictions of the new reporting method.
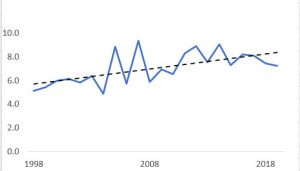
What is clear is that overall, catches have steadily increased over the last twenty years despite the increase in farm production. There is no evidence that catches have declined since the late 1990s.
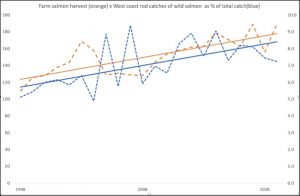
Even though, Marine Scotland Science have used percentage catch to support their claim that salmon farming has negatively impacted on wild salmon, it could be argued that percentages mask the reality of lower numbers of fish caught so I have also added the actual number of fish caught to the graph.
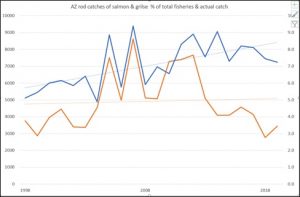
The blue line remains the catch expressed as the percentage of the total Scottish catch whilst the orange line shows the number of fish caught. Up to 2010, the number of fish caught also increased but after 2010, numbers have declined. This is undoubtedly the proof that critics claim shows the negative impact of salmon farming.
However, 2010 is also the date when east coast fisheries started to express concern about declining catches and if the number of fish caught from the west coast Aquaculture Zone (orange line) is plotted against the number of fish caught elsewhere (red line) the decline is very similar.

This shows that the declines affecting east coast rivers are also affecting west coast rivers in the same way. This has nothing to do with salmon farming.
I cannot be any clearer that the evidence from wild fish catches shows conclusively that salmon catches from rivers around the west coast Aquaculture Zone have not declined due to the presence of salmon farming. Instead, they have increased.
What is most disappointing is that I requested the opportunity to present to the Salmon Interactions Working Group after its formation had been announced. My request was refused – twice. I was told that they did not want to hear from anyone from outside the group which meant that they only heard their own opinions including those of group member John Armstrong whose view on the impacts of salmon farming are more than apparent from the MSS report mentioned earlier.
It does seem to me that eighteen months of Interactions Group meetings have taken place based on the misconception that salmon farming is a problem for west coast salmon. This is eighteen months when other issues could have been addressed instead of this exclusive but ill-judged focus on the salmon farming industry.
However, those for who I have most sympathy are the ghillies and fishery managers who oversee the east coast rivers and who have watched catches decline with almost no effort being made to try to reverse the decline. It is their jobs and livelihoods that are threatened.
The truth is that the wild fish sector has consistently failed to face up to reality. It has been so much easier just to blame salmon farmers rather than address the real issues affecting wild salmon populations across all of Scotland.
This week, the Atlantic Salmon Trust broadcast their second spring video in which they discussed the £750,000 West Coast Tracking Project and that the sole aim is to understand the migration routes taken by the fish. I look forward to hearing how this project will help salmon in the major Scottish rivers that account for the majority of the total Scottish catch. Unfortunately, this west coast tracking project is yet another unnecessary distraction that will do nothing to help reverse the declines of Scottish salmon.
Essential reading: For anyone interested in trying to help resolve the problems encountered by wild salmon in Scotland, then this link is absolutely essential reading. I am not going to add any comment as I prefer to let readers make up their own mind. The link is to a Facebook page written by Salmon & Trout Conservation’s communication consultant, but under his own name:
https://www.facebook.com/issf.org.uk/posts/972375263178880?__tn__=K-R
Catch the data: For sixty-six years, the Scottish authorities have reported annually on the rod and line catch of salmon and sea trout from 109 separate fishery districts around Scotland. In recent times, the guardians of this valuable data have been Marine Scotland Science. Each year, they publish a single graph showing the long-term trend for catches across all of Scotland. However, the data also allows the same long-term trends to be illustrated for each of the 109 fishery districts,
However, 2019 sees an end to this long running series. Marine Scotland have revised the way they present the data and have reduced the number of reporting districts from 109 to just 56. This means that some fishery districts have been amalgamated together. For example, Little Loch Broom, Gruinard, and Ewe districts are now reported as one which means that the data for the contentious Loch Ewe system is hidden with the other two. This causes endless problems not least that the districts that used to mark the limit of the Aquaculture Zone are amalgamated with districts that have no local salmon farms. It is no longer possible to distinguish the boundaries of the farming areas. It is a nightmare.
The reason for the change is that since May 2018, Marine Scotland have been led to understand that the processing of salmon and sea trout catch data is subject to the new General Data Protection Regulation (GDPR). They say that personal data can include data relating to individuals, small partnerships, and sole traders but not data relating to angling clubs, public companies, charities, or public bodies. My belief is that Marine Scotland changed the way they presented the data because one proprietor complained that they had given out data relating to his business after a FOI request to try to better understand the number of fish caught from one beat.
Personally, I have no comprehension how revealing the number of fish caught in a specific part of a river can be related to personal data. Information should be freely available not only about the number of fish caught in a fishery district, but in which parts of any river. Many proprietors freely advertise how many fish have been caught on their beat as well as how much they charge to fish. If anyone was so motivated, it should be possible to calculate their approximate income, but the data has been available for years and no-one has yet seemed inclined to pursue such an investigation. These proprietors clearly do not see this as an invasion of privacy so how can revealing the number of fish caught from another beat be an infringement of GDPR.
My own view is that we need to know more about salmon catches not less if we are to safeguard wild fish. My appeal to Marine Scotland has so far fallen on deaf ears and I will be looking at other ways to get this very blinkered decision reversed.
One option would be to follow Salmon & Trout Conservation’s example and raise a petition that can be taken to the Scottish Parliament’s Rural Economy Committee for an inquiry. After all, the convenor has already declared an interest in wild fisheries and so would be expected to support wider availability of data. He has already overseen one inquiry into the protection of wild salmon with demands for the farmed salmon sector to publish more data more frequently. Surely, he would support a request for similar transparency from the wild fish sector. Perhaps, a more direct approach may persuade him to lobby Marine Scotland direct rather than go through the rigmarole of yet another salmon related inquiry. Yet given the demands from the wild fish sector that salmon should be made a National Priority, an inquiry may not be such a bad thing anyway.